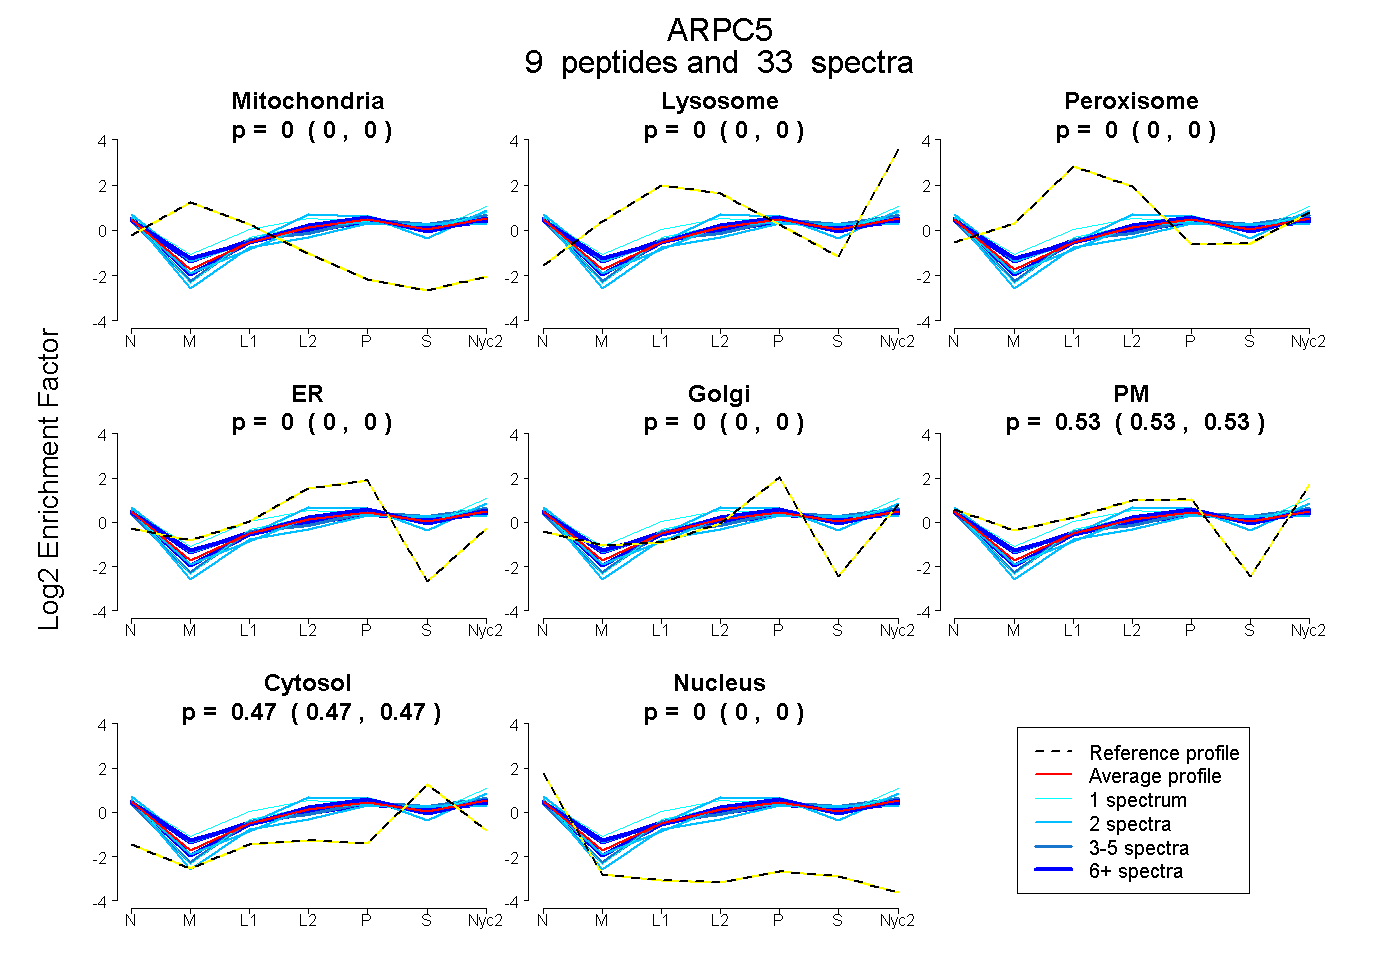
 9
9peptides
spectra
0.000 | 0.000
0.000 | 0.000
0.000 | 0.000
0.000 | 0.000
0.000 | 0.000
0.526 | 0.534
0.465 | 0.473
0.000 | 0.000
| Plot | Mito | Lyso | Perox | ER | Golgi | PM | Cytosol | Nucleus | |||||
| Expt A |
9 peptides |
33 spectra |
|
0.000 0.000 | 0.000 |
0.000 0.000 | 0.000 |
0.000 0.000 | 0.000 |
0.000 0.000 | 0.000 |
0.000 0.000 | 0.000 |
0.531 0.526 | 0.534 |
0.469 0.465 | 0.473 |
0.000 0.000 | 0.000 |
| 1 spectrum, NGVDLLMK | 0.000 | 0.000 | 0.140 | 0.000 | 0.000 | 0.537 | 0.323 | 0.000 | ||
| 7 spectra, ALAAGGVGSIVR | 0.000 | 0.000 | 0.018 | 0.000 | 0.000 | 0.507 | 0.475 | 0.000 | ||
| 2 spectra, VLISFK | 0.000 | 0.000 | 0.000 | 0.000 | 0.014 | 0.405 | 0.563 | 0.018 | ||
| 2 spectra, NPPINTK | 0.000 | 0.000 | 0.000 | 0.000 | 0.000 | 0.497 | 0.503 | 0.000 | ||
| 9 spectra, VLTAR | 0.000 | 0.000 | 0.000 | 0.001 | 0.000 | 0.575 | 0.425 | 0.000 | ||
| 6 spectra, ANDIEK | 0.000 | 0.000 | 0.000 | 0.000 | 0.000 | 0.504 | 0.496 | 0.000 | ||
| 3 spectra, GFESPSDNSSAMLLQWHEK | 0.000 | 0.000 | 0.000 | 0.000 | 0.000 | 0.482 | 0.518 | 0.000 | ||
| 1 spectrum, NTVSSAR | 0.000 | 0.000 | 0.000 | 0.000 | 0.000 | 0.554 | 0.446 | 0.000 | ||
| 2 spectra, QGNMTAALQAALK | 0.000 | 0.000 | 0.000 | 0.000 | 0.000 | 0.655 | 0.345 | 0.000 |
| Plot | Mito | Lyso or Perox | ER | Golgi | PM | Cytosol | Nucleus | ||||||
| Expt B |
3 peptides |
6 spectra |
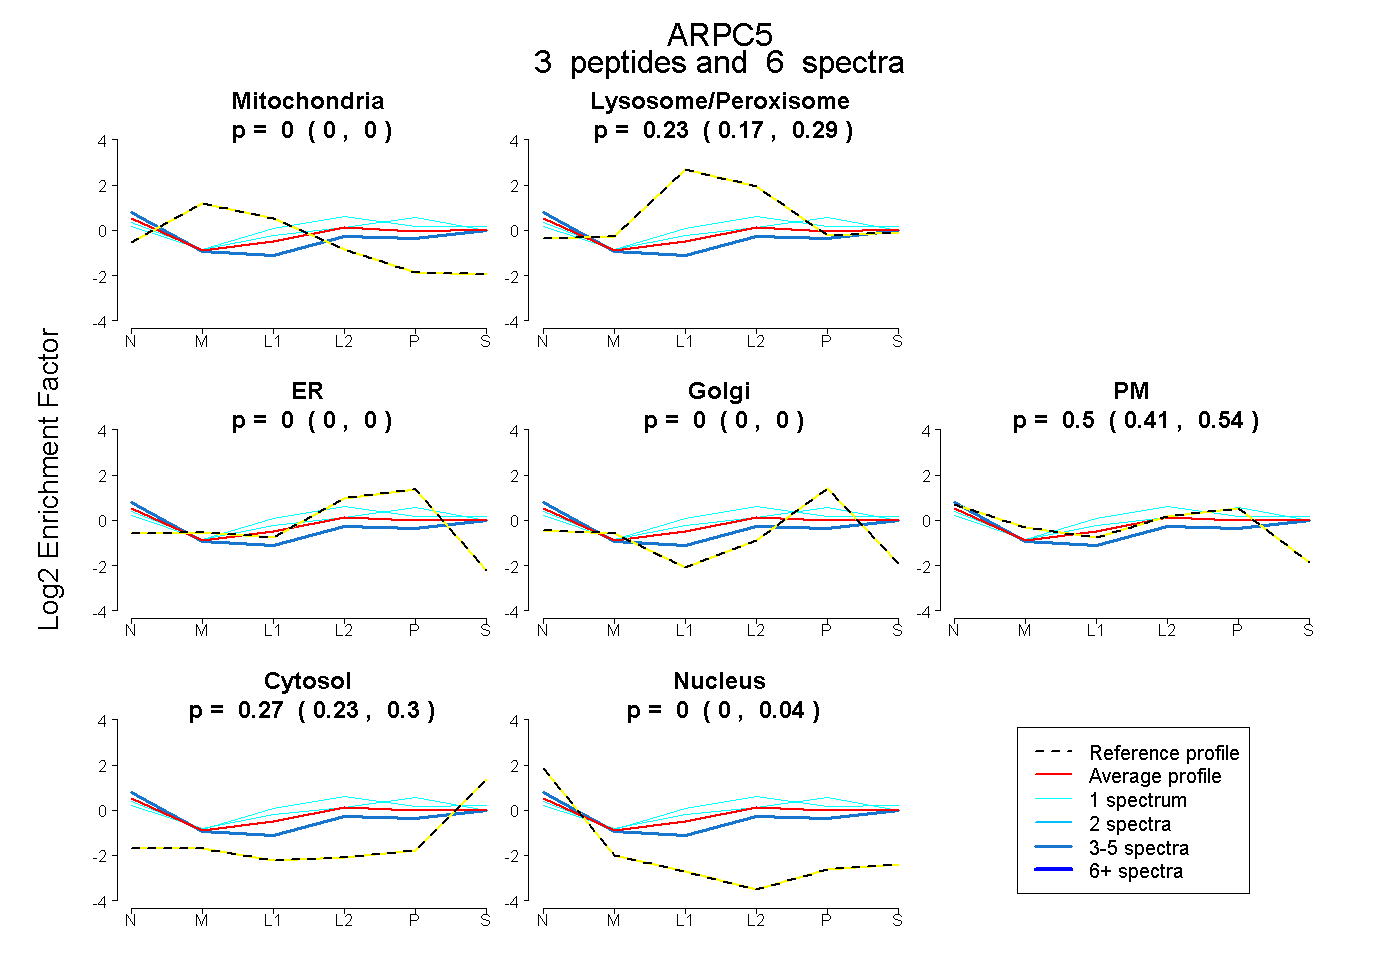 |
0.000 0.000 | 0.000 |
0.230 0.174 | 0.293 |
0.000 0.000 | 0.000 |
0.000 0.000 | 0.000 |
0.502 0.414 | 0.544 |
0.268 0.229 | 0.295 |
0.000 0.000 | 0.036 |
|||
| Plot | Lyso | Other | |||||||||||
| Expt C |
9 peptides |
38 spectra |
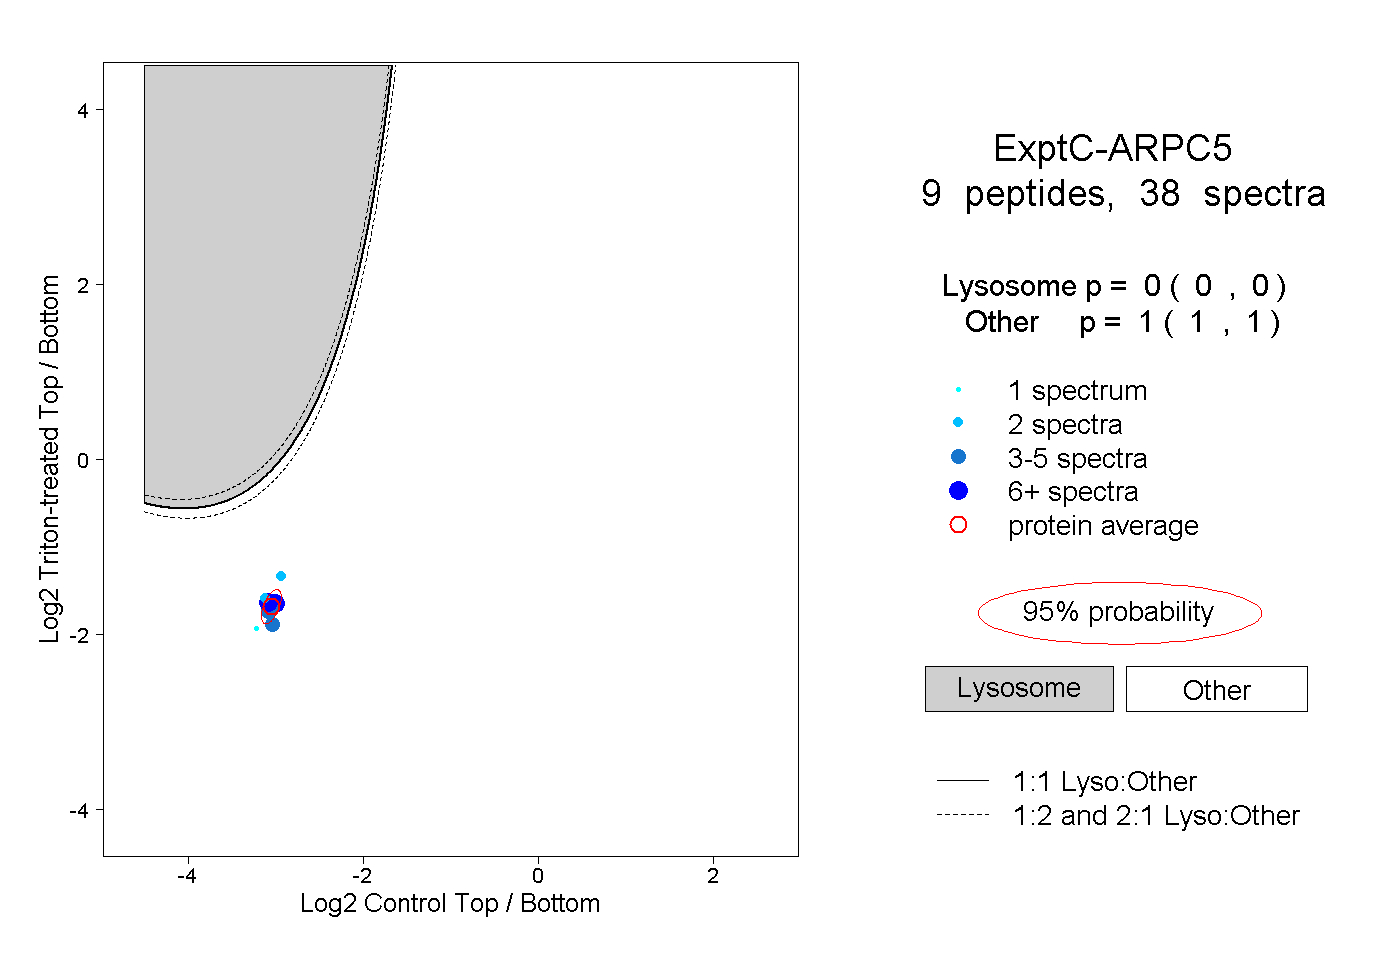 |
0.000 0.000 | 0.000 |
1.000 1.000 | 1.000 |
||||||||
| Plot | Lyso | Other | |||||||||||
| Expt D |
2 peptides |
2 spectra |
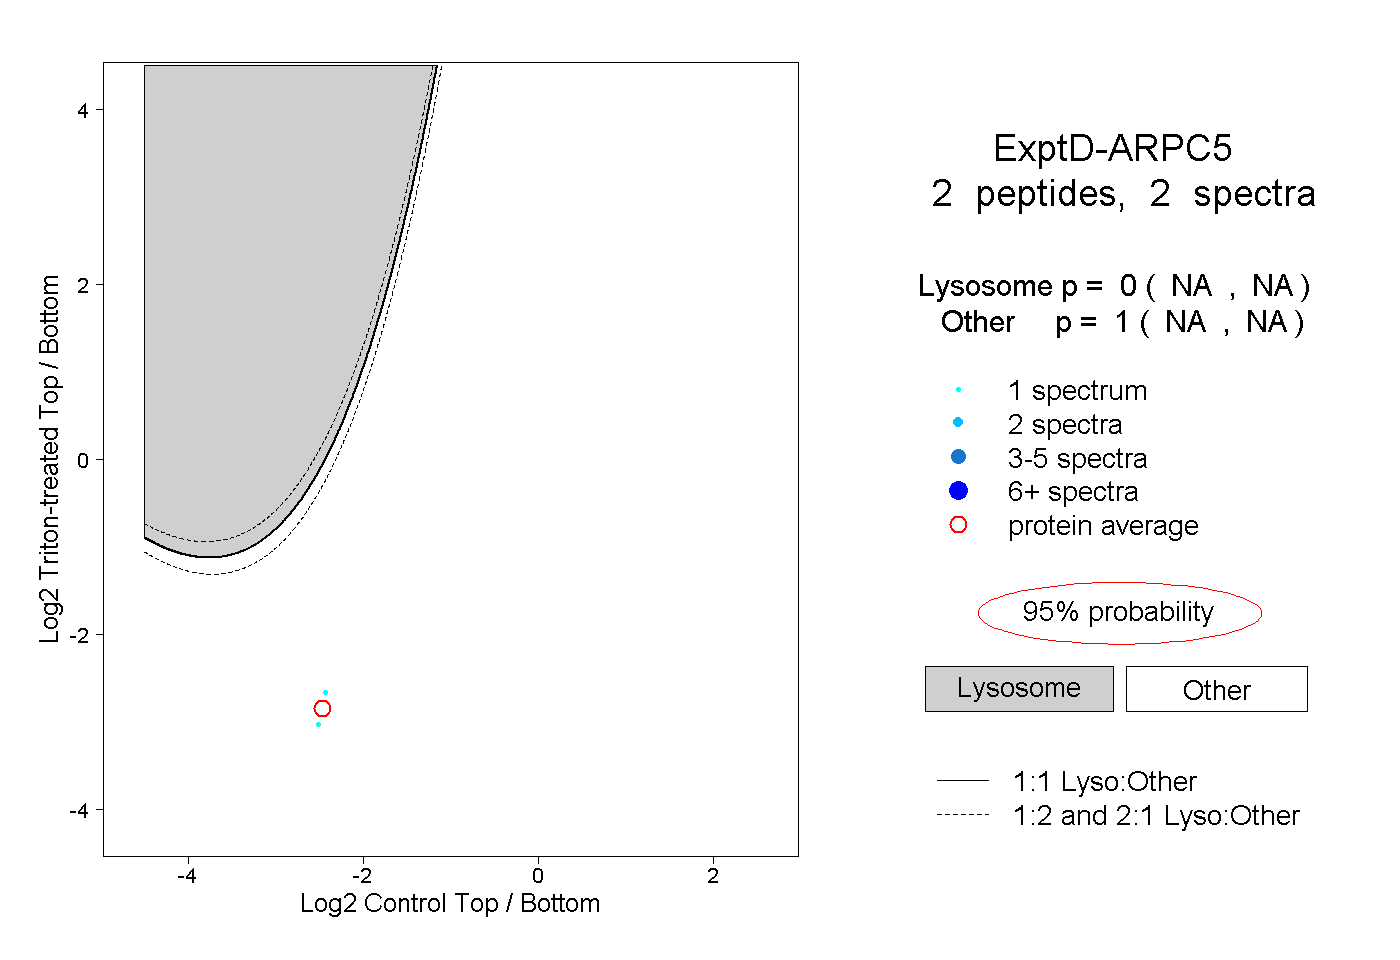 |
0.000 NA | NA |
1.000 NA | NA |