 4
4peptides
spectra
0.000 | 0.049
0.000 | 0.000
0.000 | 0.087
0.000 | 0.114
0.000 | 0.085
0.318 | 0.521
0.383 | 0.492
0.000 | 0.044
| Plot | Mito | Lyso | Perox | ER | Golgi | PM | Cytosol | Nucleus | |||||
| Expt A |
4 peptides |
8 spectra |
|
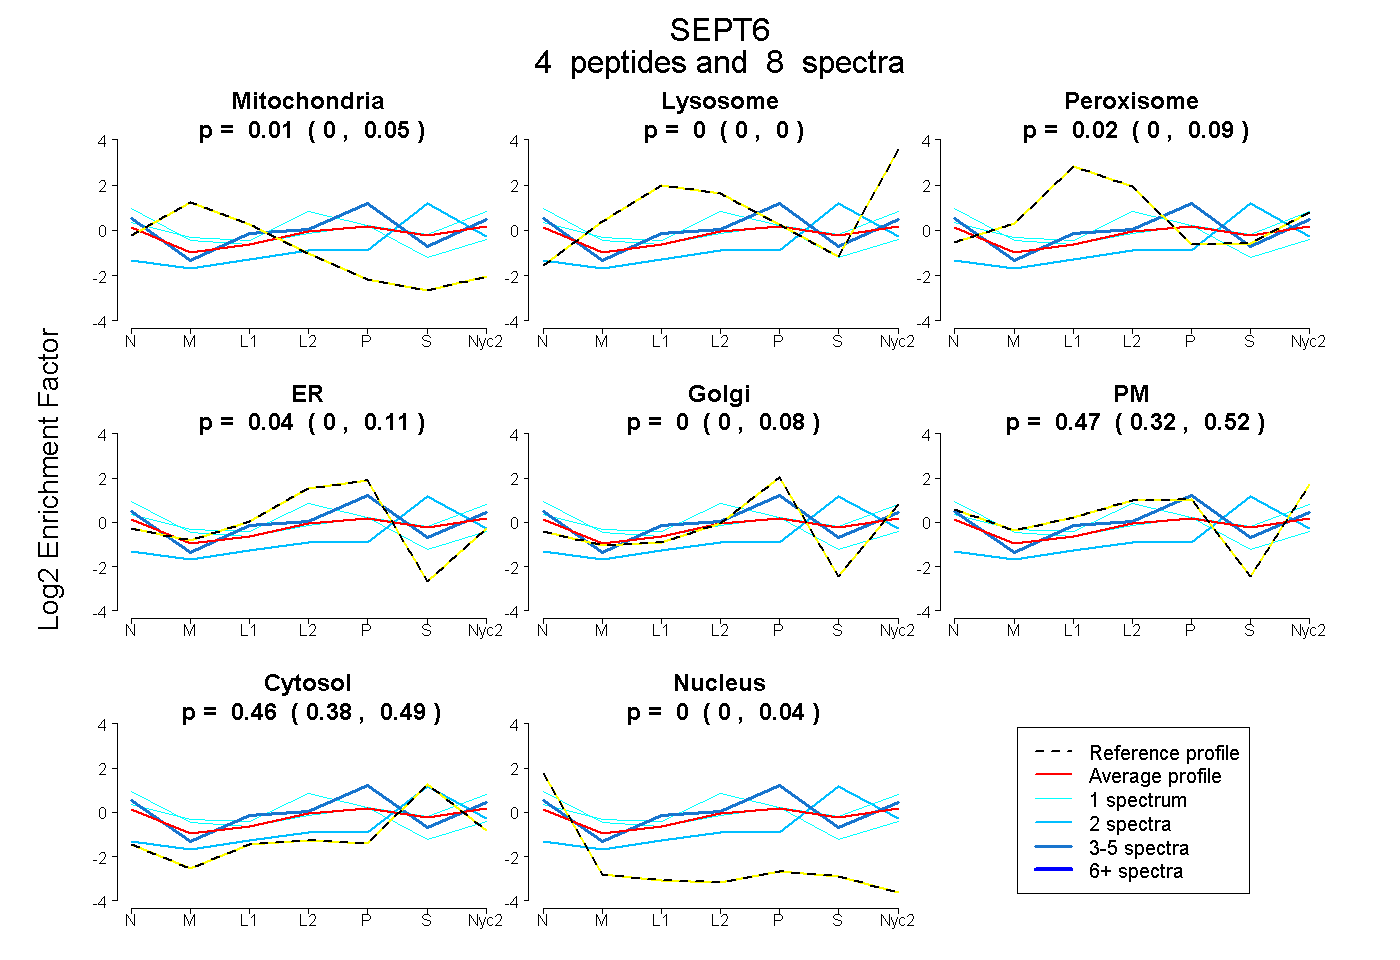
0.010 0.000 | 0.049 |
0.000 0.000 | 0.000 |
0.022 0.000 | 0.087 |
0.037 0.000 | 0.114 |
0.000 0.000 | 0.085 |
0.471 0.318 | 0.521 |
0.459 0.383 | 0.492 |
0.001 0.000 | 0.044 |
| 4 spectra, QMFVQR | 0.000 | 0.000 | 0.000 | 0.097 | 0.145 | 0.459 | 0.299 | 0.000 | ||
| 1 spectrum, MAAADIAR | 0.000 | 0.000 | 0.154 | 0.000 | 0.000 | 0.537 | 0.309 | 0.000 | ||
| 1 spectrum, IHQEEK | 0.089 | 0.000 | 0.041 | 0.092 | 0.000 | 0.460 | 0.163 | 0.155 | ||
| 2 spectra, LHEEEK | 0.000 | 0.114 | 0.000 | 0.000 | 0.036 | 0.000 | 0.850 | 0.000 |