 11
11peptides
spectra
0.000 | 0.000
0.000 | 0.000
0.000 | 0.000
0.000 | 0.000
0.000 | 0.000
0.000 | 0.000
1.000 | 1.000
0.000 | 0.000
| Plot | Mito | Lyso | Perox | ER | Golgi | PM | Cytosol | Nucleus | |||||
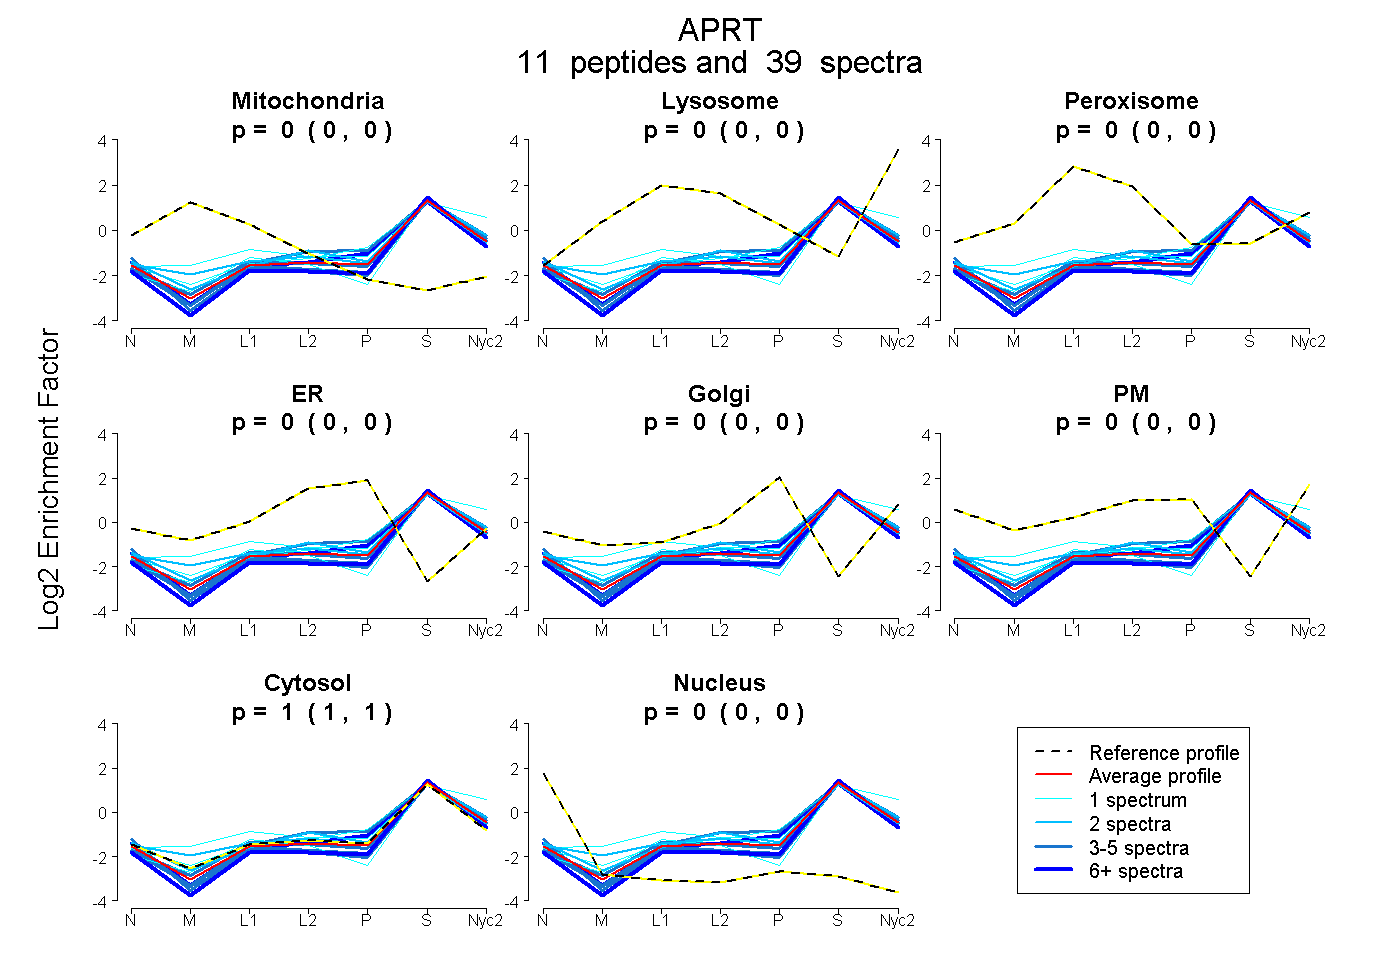
| Expt A |
11 peptides |
39 spectra |
|
0.000 0.000 | 0.000 |
0.000 0.000 | 0.000 |
0.000 0.000 | 0.000 |
0.000 0.000 | 0.000 |
0.000 0.000 | 0.000 |
0.000 0.000 | 0.000 |
1.000 1.000 | 1.000 |
0.000 0.000 | 0.000 |
| 4 spectra, LLAGHLK | 0.000 | 0.000 | 0.000 | 0.000 | 0.000 | 0.000 | 1.000 | 0.000 | ||
| 2 spectra, SESELQLVAR | 0.000 | 0.048 | 0.000 | 0.000 | 0.000 | 0.000 | 0.952 | 0.000 | ||
| 1 spectrum, AEVVECVSLVELTSLK | 0.000 | 0.210 | 0.000 | 0.000 | 0.000 | 0.000 | 0.790 | 0.000 | ||
| 6 spectra, SFPDFPIPGVLFR | 0.000 | 0.000 | 0.000 | 0.000 | 0.000 | 0.000 | 0.993 | 0.007 | ||
| 4 spectra, IDYIAGLDSR | 0.000 | 0.000 | 0.000 | 0.000 | 0.000 | 0.000 | 0.996 | 0.004 | ||
| 4 spectra, DALEPGQK | 0.000 | 0.007 | 0.000 | 0.000 | 0.033 | 0.000 | 0.960 | 0.000 | ||
| 1 spectrum, LPGPTVSASYSLEYGK | 0.000 | 0.000 | 0.000 | 0.000 | 0.000 | 0.000 | 1.000 | 0.000 | ||
| 4 spectra, DISPLLK | 0.000 | 0.000 | 0.000 | 0.000 | 0.000 | 0.000 | 0.975 | 0.025 | ||
| 10 spectra, AELEIQK | 0.000 | 0.000 | 0.000 | 0.000 | 0.000 | 0.000 | 1.000 | 0.000 | ||
| 2 spectra, STHGGK | 0.024 | 0.053 | 0.000 | 0.000 | 0.000 | 0.000 | 0.923 | 0.000 | ||
| 1 spectrum, DPDSFR | 0.000 | 0.005 | 0.000 | 0.000 | 0.071 | 0.000 | 0.923 | 0.000 |
| Plot | Mito | Lyso or Perox | ER | Golgi | PM | Cytosol | Nucleus | ||||||
| Expt B |
4 peptides |
11 spectra |
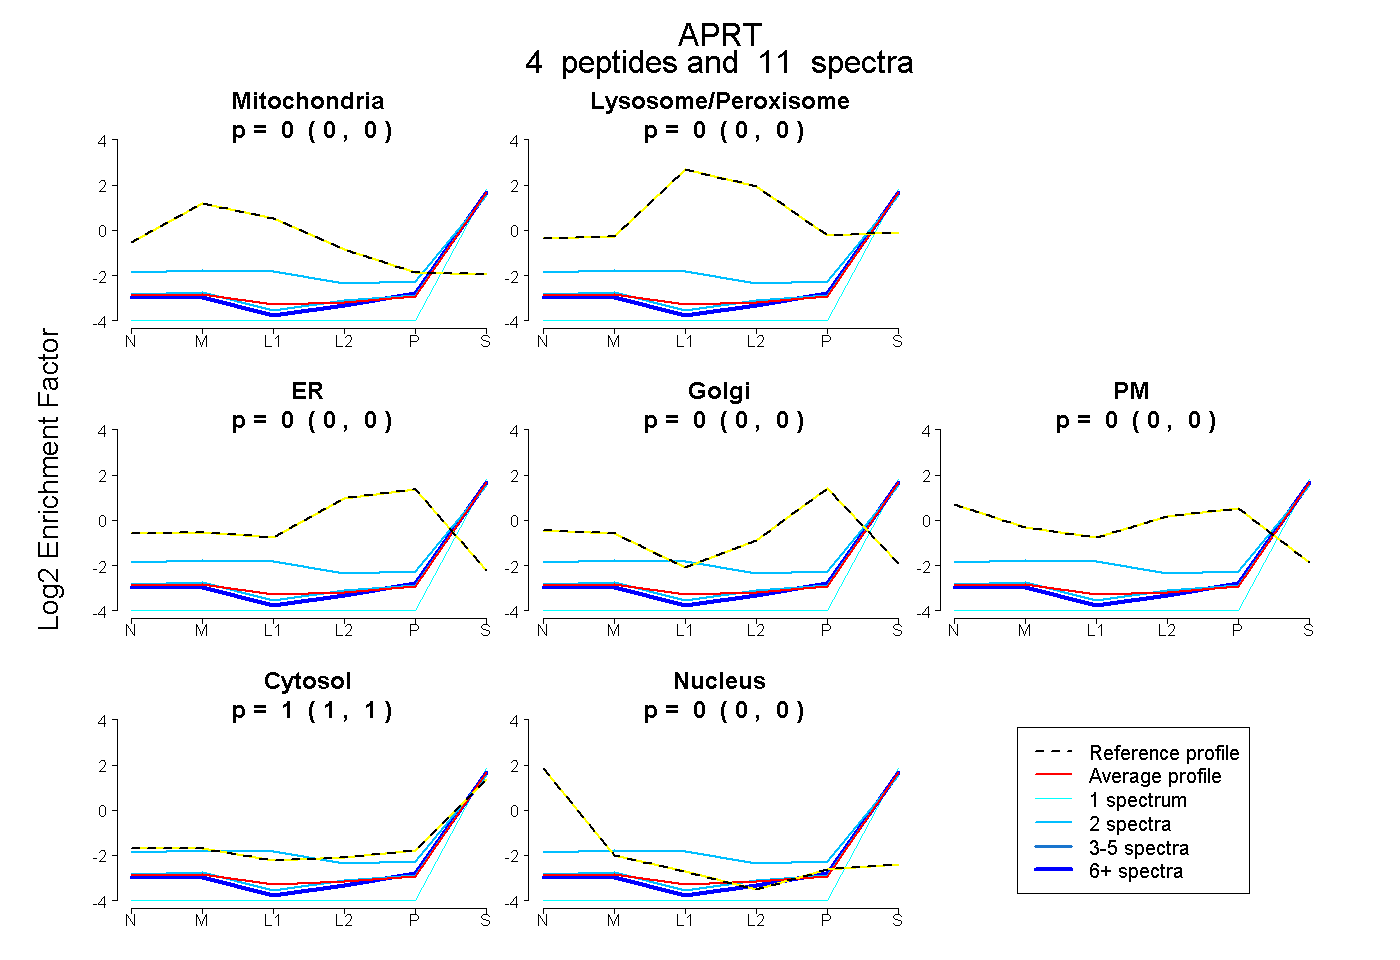 |
0.000 0.000 | 0.000 |
0.000 0.000 | 0.000 |
0.000 0.000 | 0.000 |
0.000 0.000 | 0.000 |
0.000 0.000 | 0.000 |
1.000 1.000 | 1.000 |
0.000 0.000 | 0.000 |
|||
| Plot | Lyso | Other | |||||||||||
| Expt C |
8 peptides |
32 spectra |
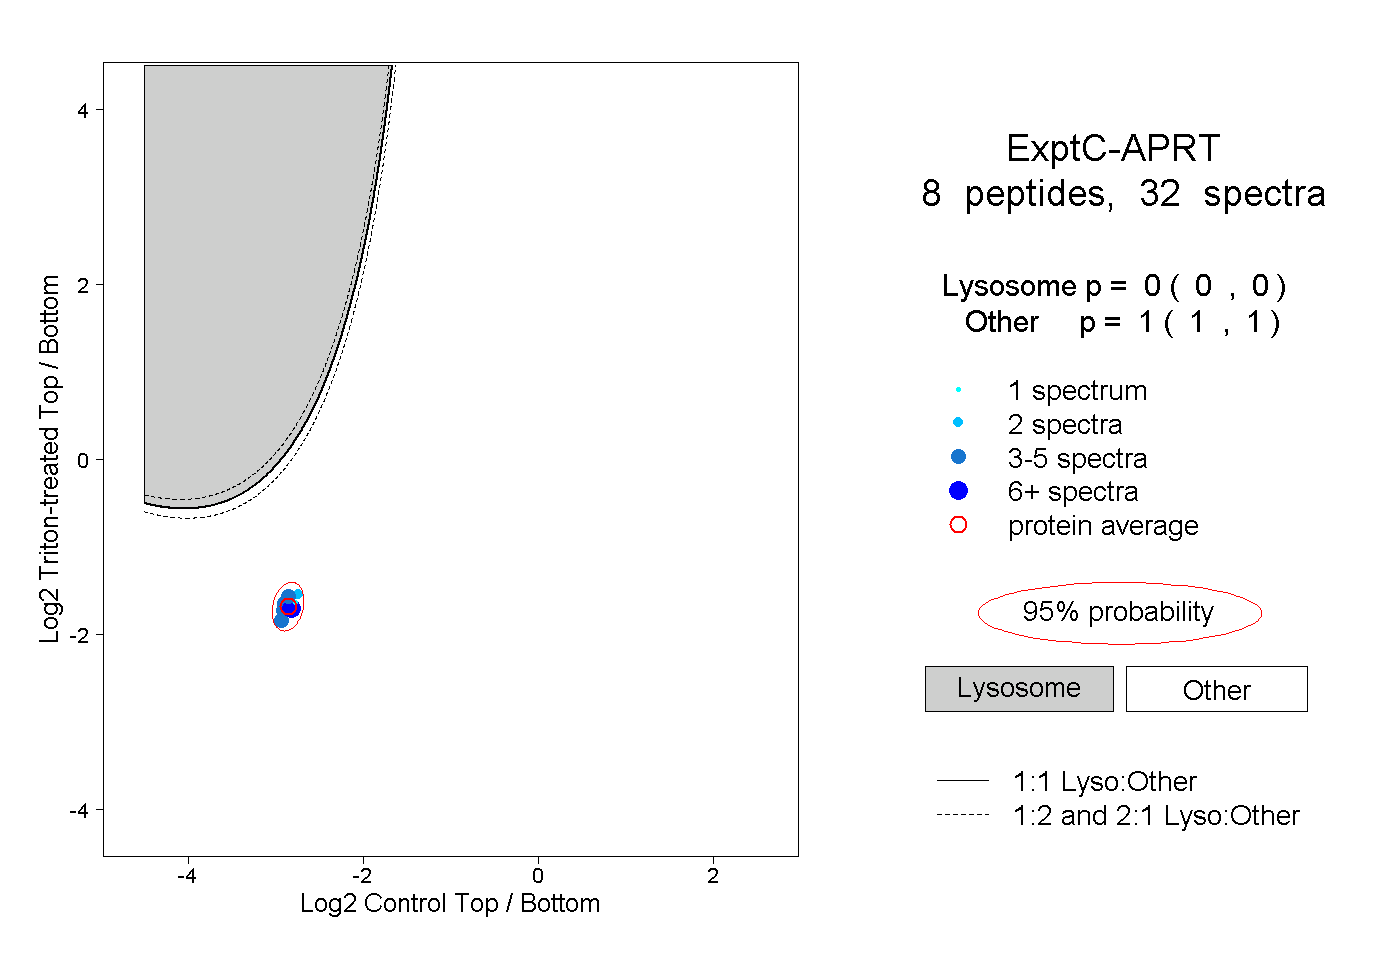 |
0.000 0.000 | 0.000 |
1.000 1.000 | 1.000 |
||||||||
| Plot | Lyso | Other | |||||||||||
| Expt D |
2 peptides |
5 spectra |
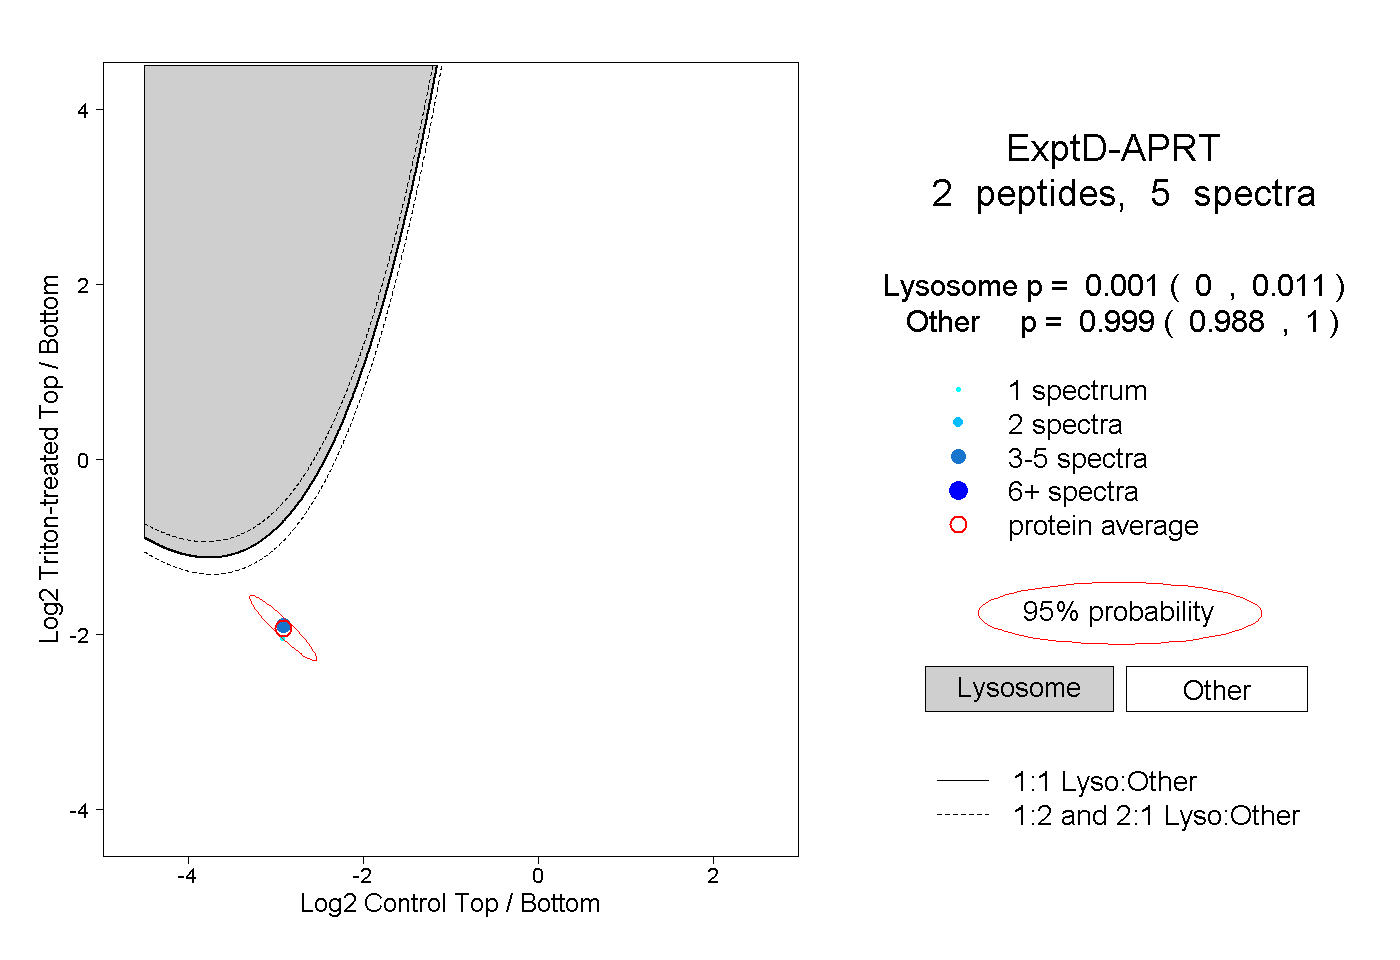 |
0.001 0.000 | 0.011 |
0.999 0.988 | 1.000 |