 7
7peptides
spectra
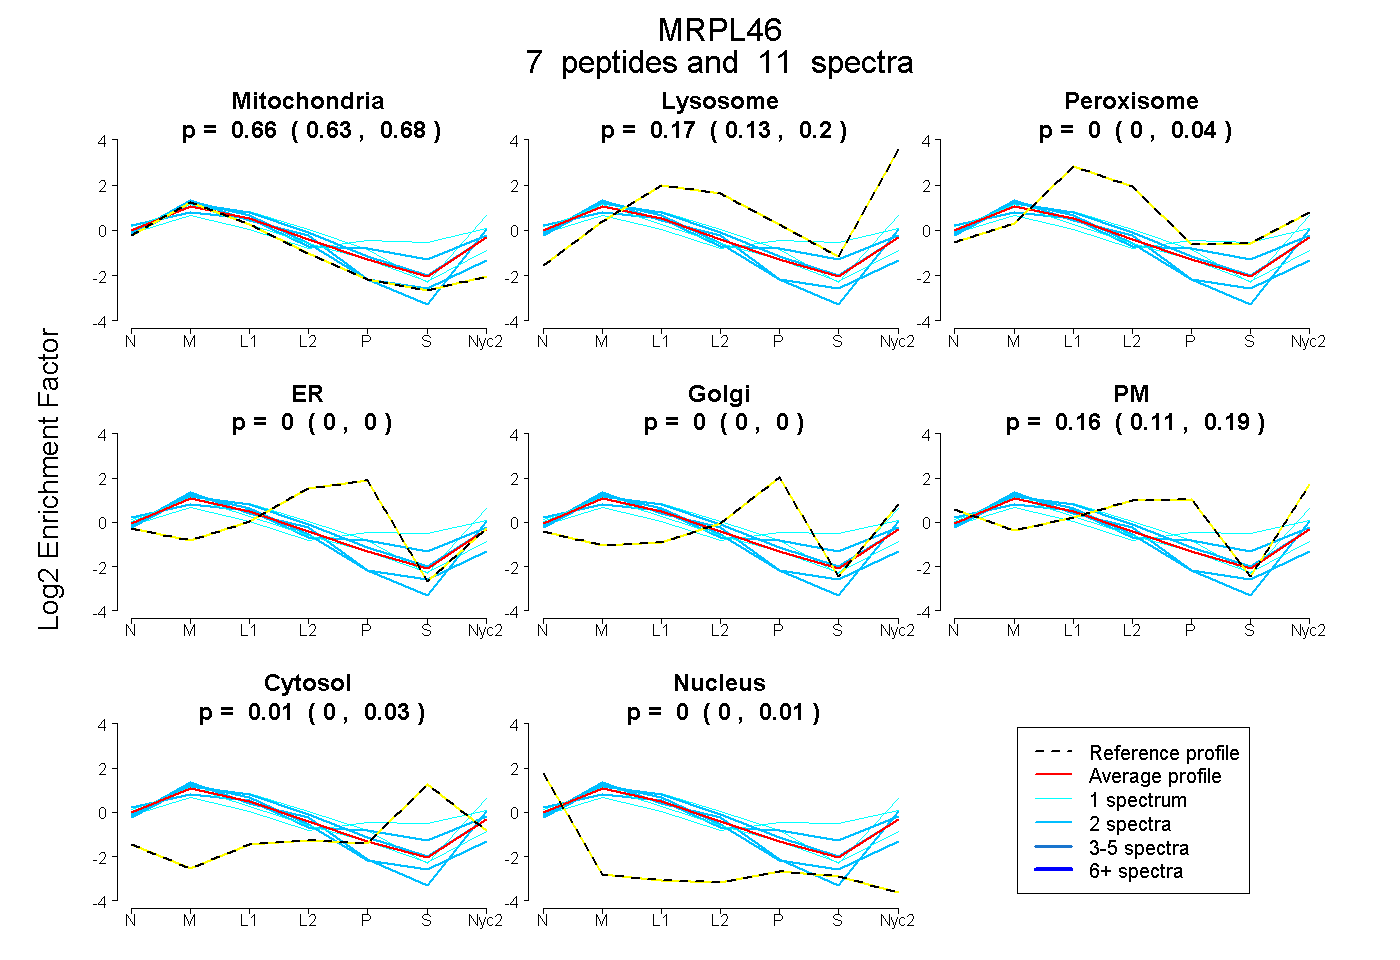
0.629 | 0.679
0.131 | 0.196
0.000 | 0.038
0.000 | 0.000
0.000 | 0.000
0.113 | 0.187
0.000 | 0.027
0.000 | 0.007
1peptide
spectra
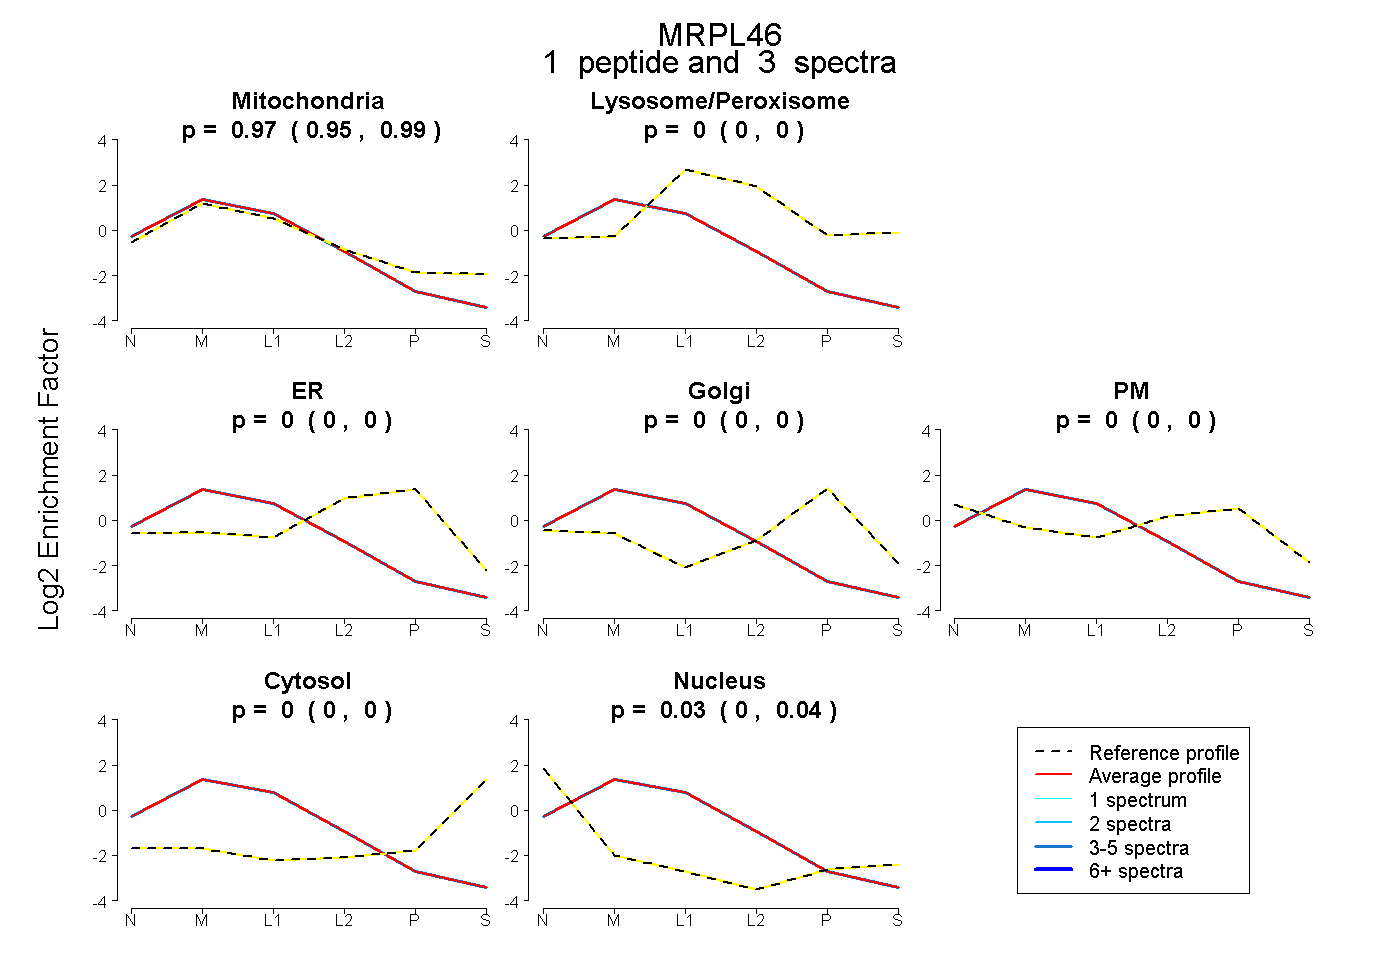
0.952 | 0.995
0.000 | 0.000
0.000 | 0.000
0.000 | 0.000
0.000 | 0.000
0.000 | 0.000
0.002 | 0.044
8peptides
spectra
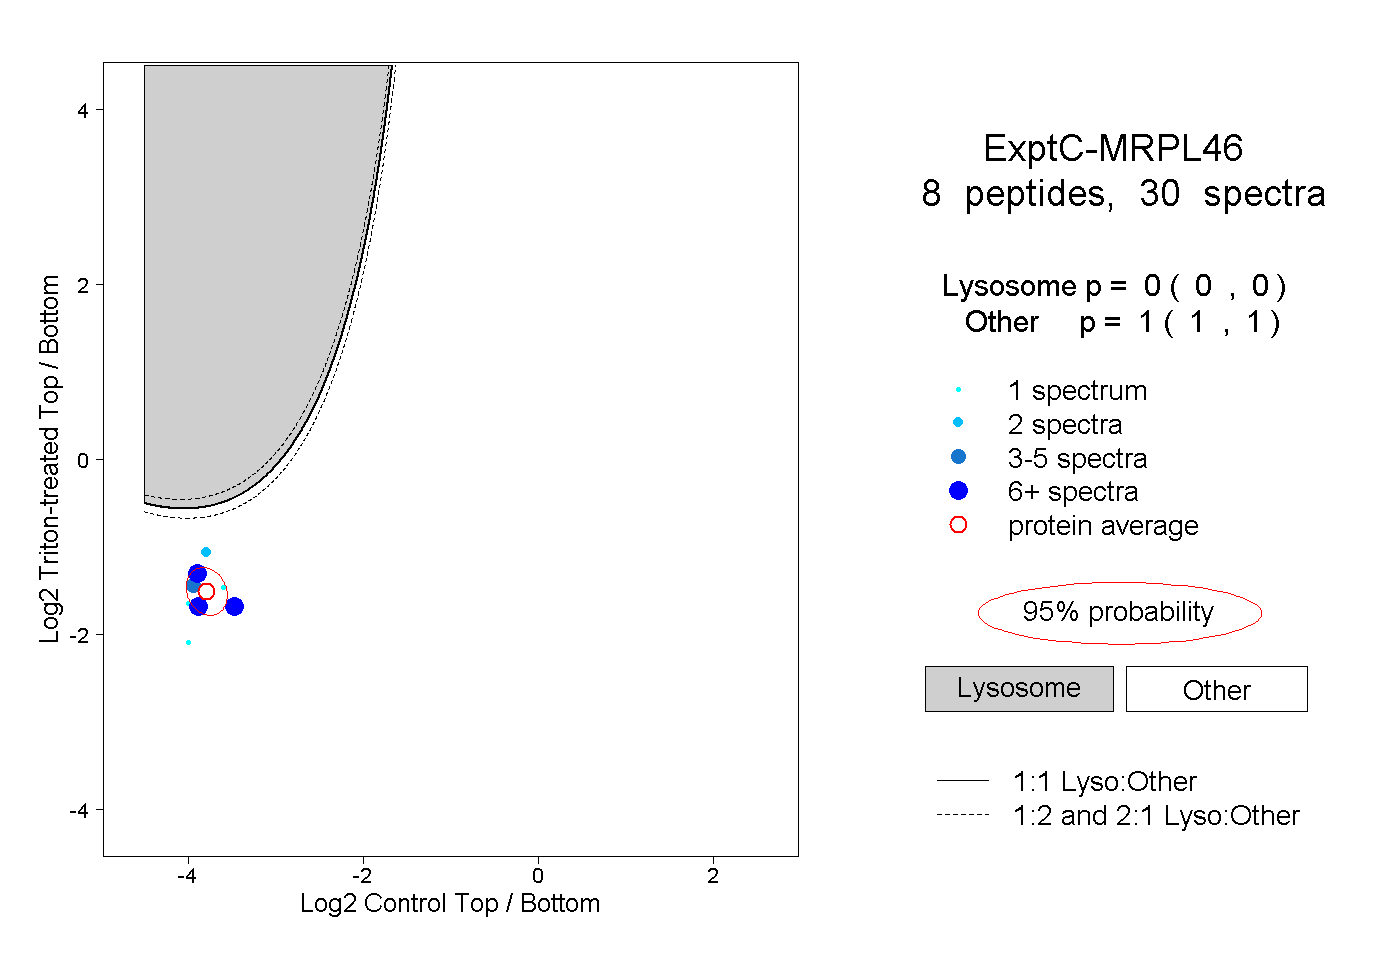
0.000 | 0.000
1.000 | 1.000