 14
14peptides
spectra
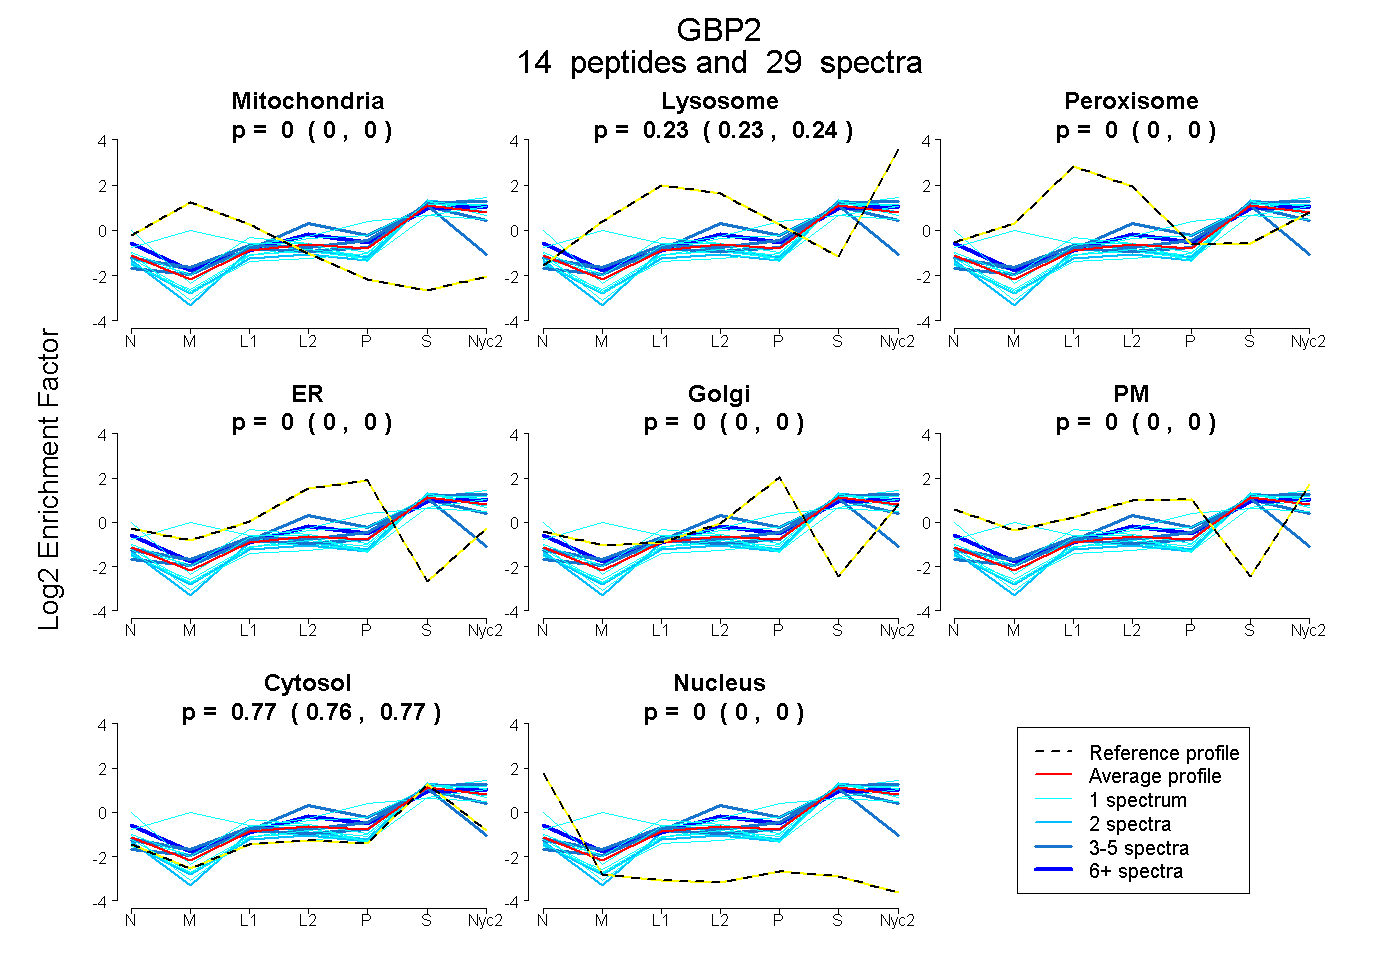
0.000 | 0.000
0.228 | 0.241
0.000 | 0.000
0.000 | 0.000
0.000 | 0.000
0.000 | 0.000
0.758 | 0.771
0.000 | 0.000
6peptides
spectra
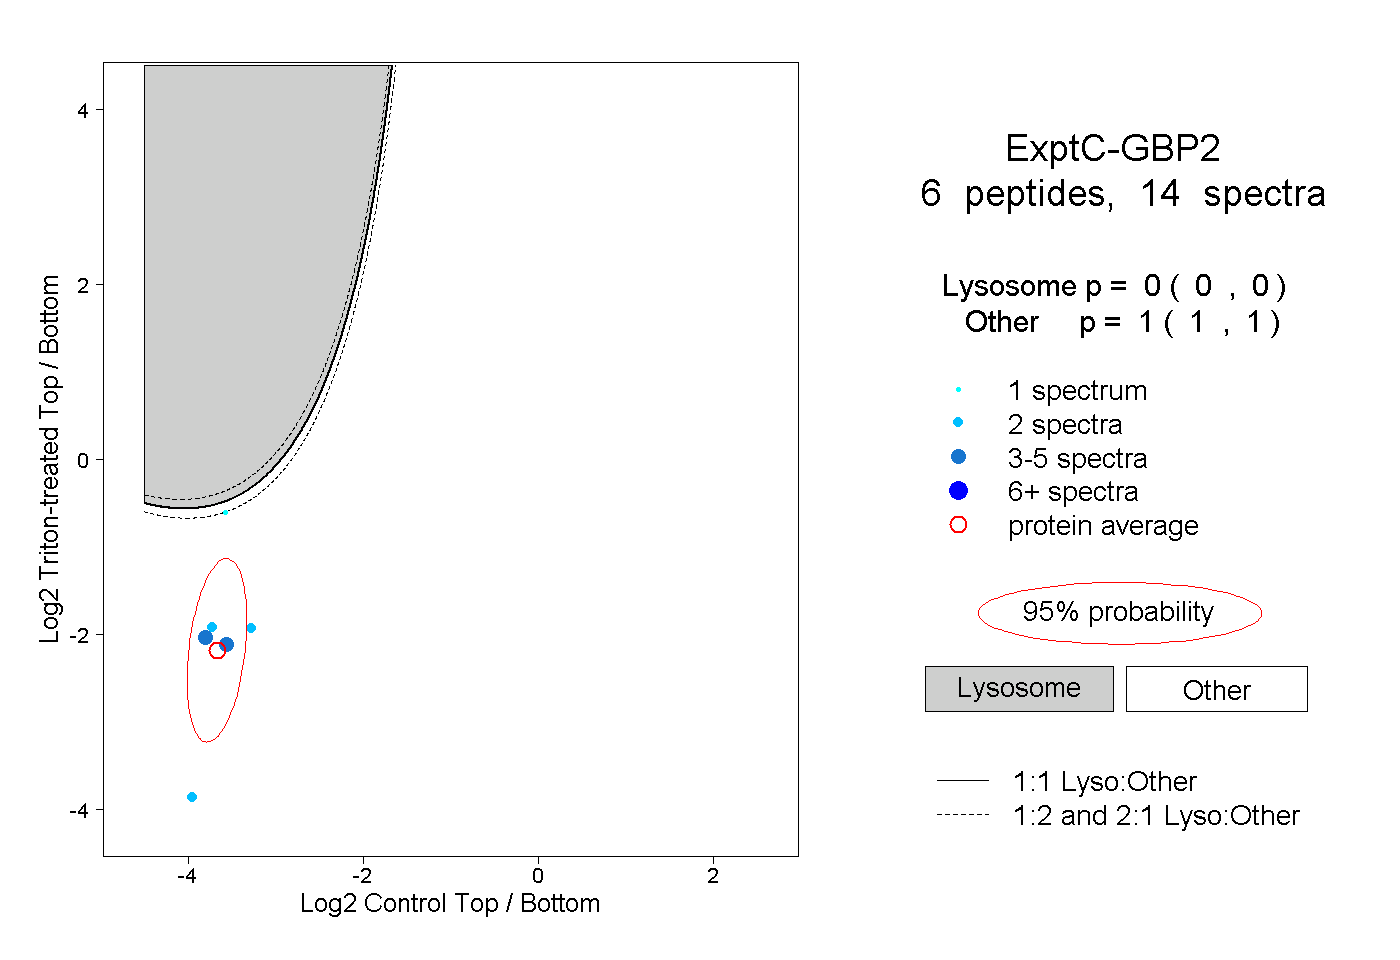
0.000 | 0.000
1.000 | 1.000
| Plot | Mito | Lyso | Perox | ER | Golgi | PM | Cytosol | Nucleus | |||||
| Expt A |
14 peptides |
29 spectra |
|
0.000 0.000 | 0.000 |
0.235 0.228 | 0.241 |
0.000 0.000 | 0.000 |
0.000 0.000 | 0.000 |
0.000 0.000 | 0.000 |
0.000 0.000 | 0.000 |
0.765 0.758 | 0.771 |
0.000 0.000 | 0.000 |
||
| Plot | Lyso | Other | |||||||||||
| Expt C |
6 peptides |
14 spectra |
|
0.000 0.000 | 0.000 |
1.000 1.000 | 1.000 |
| 2 spectra, EAIEIFLK | 0.000 | 1.000 | ||||||||
| 2 spectra, YNQAPGK | 0.000 | 1.000 | ||||||||
| 2 spectra, TDQSLTEAAK | 0.000 | 1.000 | ||||||||
| 1 spectrum, SFNEPR | 0.199 | 0.801 | ||||||||
| 4 spectra, EGYENESK | 0.000 | 1.000 | ||||||||
| 3 spectra, AITHYEEQMNQK | 0.000 | 1.000 |
| Plot | Lyso | Other | |||||||||||
| Expt D |
1 peptide |
2 spectra |
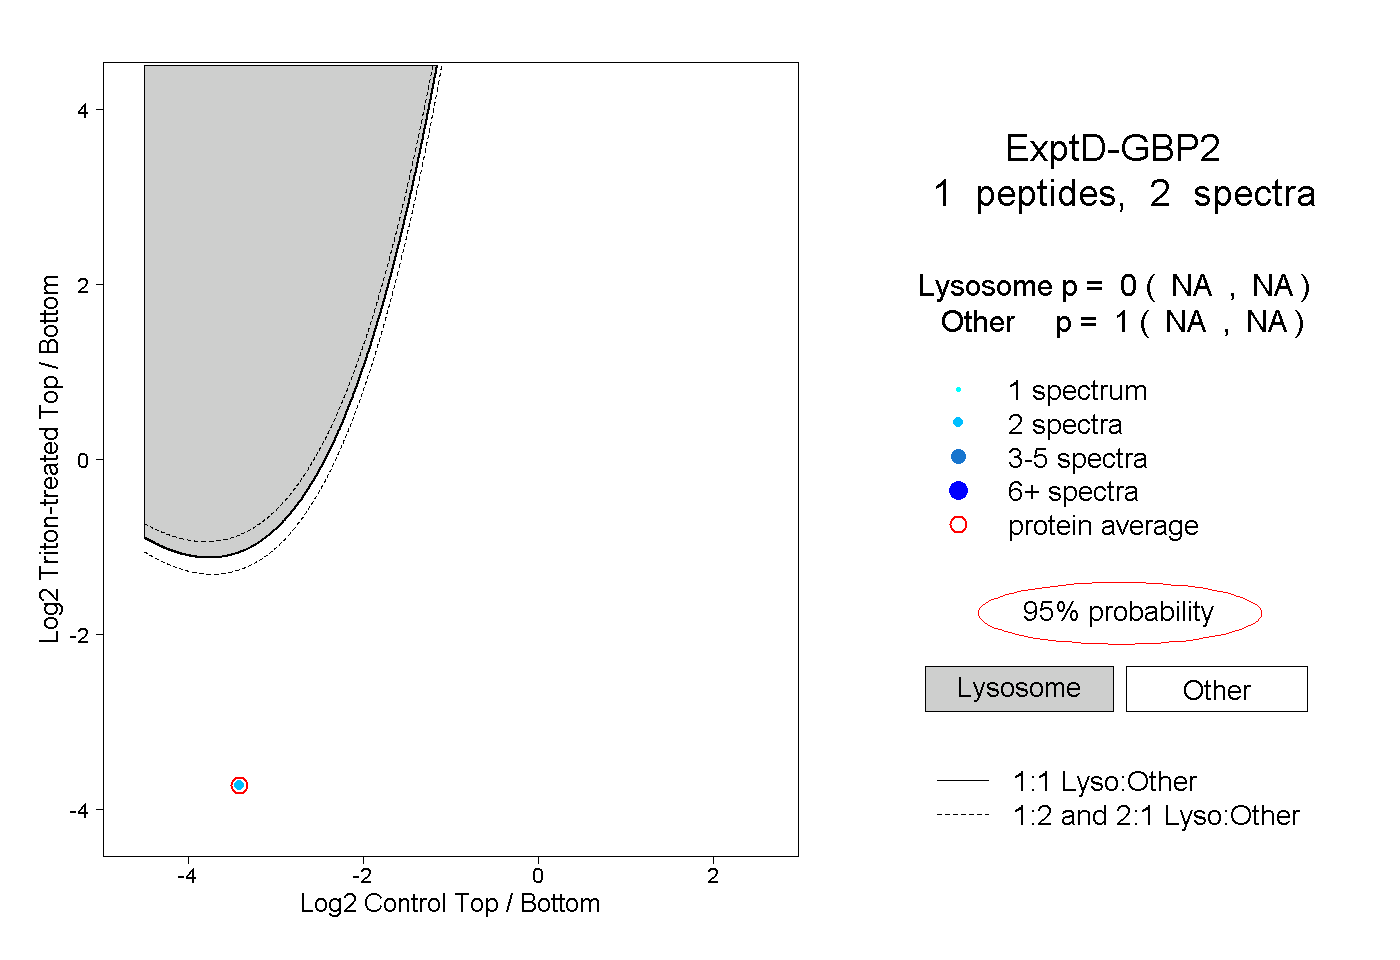 |
0.000 NA | NA |
1.000 NA | NA |