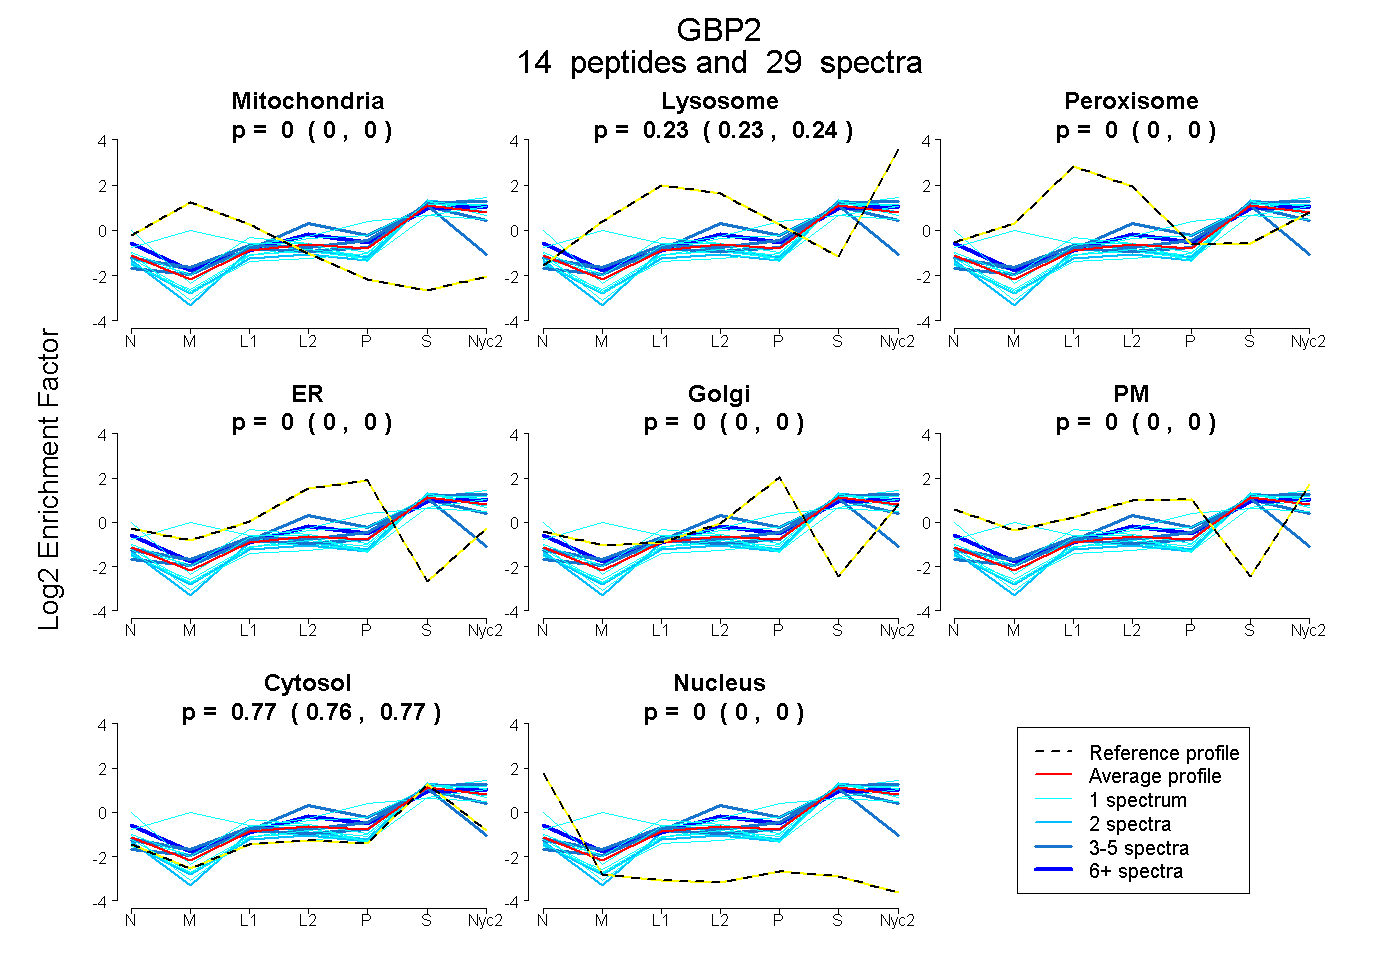
 14
14peptides
spectra
0.000 | 0.000
0.228 | 0.241
0.000 | 0.000
0.000 | 0.000
0.000 | 0.000
0.000 | 0.000
0.758 | 0.771
0.000 | 0.000
| Plot | Mito | Lyso | Perox | ER | Golgi | PM | Cytosol | Nucleus | |||||
| Expt A |
14 peptides |
29 spectra |
|
0.000 0.000 | 0.000 |
0.235 0.228 | 0.241 |
0.000 0.000 | 0.000 |
0.000 0.000 | 0.000 |
0.000 0.000 | 0.000 |
0.000 0.000 | 0.000 |
0.765 0.758 | 0.771 |
0.000 0.000 | 0.000 |
| 1 spectrum, LIEEQDNIIALK | 0.000 | 0.188 | 0.000 | 0.000 | 0.000 | 0.000 | 0.812 | 0.000 | ||
| 4 spectra, GIWMWCVPHPK | 0.000 | 0.000 | 0.107 | 0.112 | 0.000 | 0.000 | 0.781 | 0.000 | ||
| 2 spectra, EAIEIFLK | 0.000 | 0.161 | 0.000 | 0.000 | 0.000 | 0.000 | 0.839 | 0.000 | ||
| 1 spectrum, EDIVETLLK | 0.000 | 0.162 | 0.000 | 0.000 | 0.000 | 0.000 | 0.838 | 0.000 | ||
| 1 spectrum, YNQAPGK | 0.000 | 0.000 | 0.000 | 0.000 | 0.026 | 0.373 | 0.601 | 0.000 | ||
| 1 spectrum, TDQSLTEAAK | 0.000 | 0.118 | 0.000 | 0.000 | 0.000 | 0.000 | 0.882 | 0.000 | ||
| 3 spectra, IQMPTETLQELLDLHR | 0.000 | 0.270 | 0.000 | 0.000 | 0.000 | 0.000 | 0.730 | 0.000 | ||
| 4 spectra, CFIFDRPALR | 0.000 | 0.240 | 0.000 | 0.095 | 0.000 | 0.000 | 0.664 | 0.000 | ||
| 6 spectra, EESYQEHVR | 0.000 | 0.207 | 0.000 | 0.000 | 0.000 | 0.140 | 0.653 | 0.000 | ||
| 1 spectrum, TGFSLGSTVQSHTK | 0.000 | 0.303 | 0.000 | 0.000 | 0.000 | 0.000 | 0.697 | 0.000 | ||
| 2 spectra, AETAEAANR | 0.000 | 0.134 | 0.000 | 0.000 | 0.000 | 0.000 | 0.866 | 0.000 | ||
| 1 spectrum, EGYENESK | 0.000 | 0.315 | 0.000 | 0.000 | 0.026 | 0.000 | 0.659 | 0.000 | ||
| 1 spectrum, FQTELGNLLISK | 0.000 | 0.181 | 0.000 | 0.000 | 0.000 | 0.000 | 0.819 | 0.000 | ||
| 1 spectrum, TLSGGIIVNGPR | 0.140 | 0.342 | 0.000 | 0.000 | 0.000 | 0.000 | 0.518 | 0.000 |
| Plot | Lyso | Other | |||||||||||
| Expt C |
6 peptides |
14 spectra |
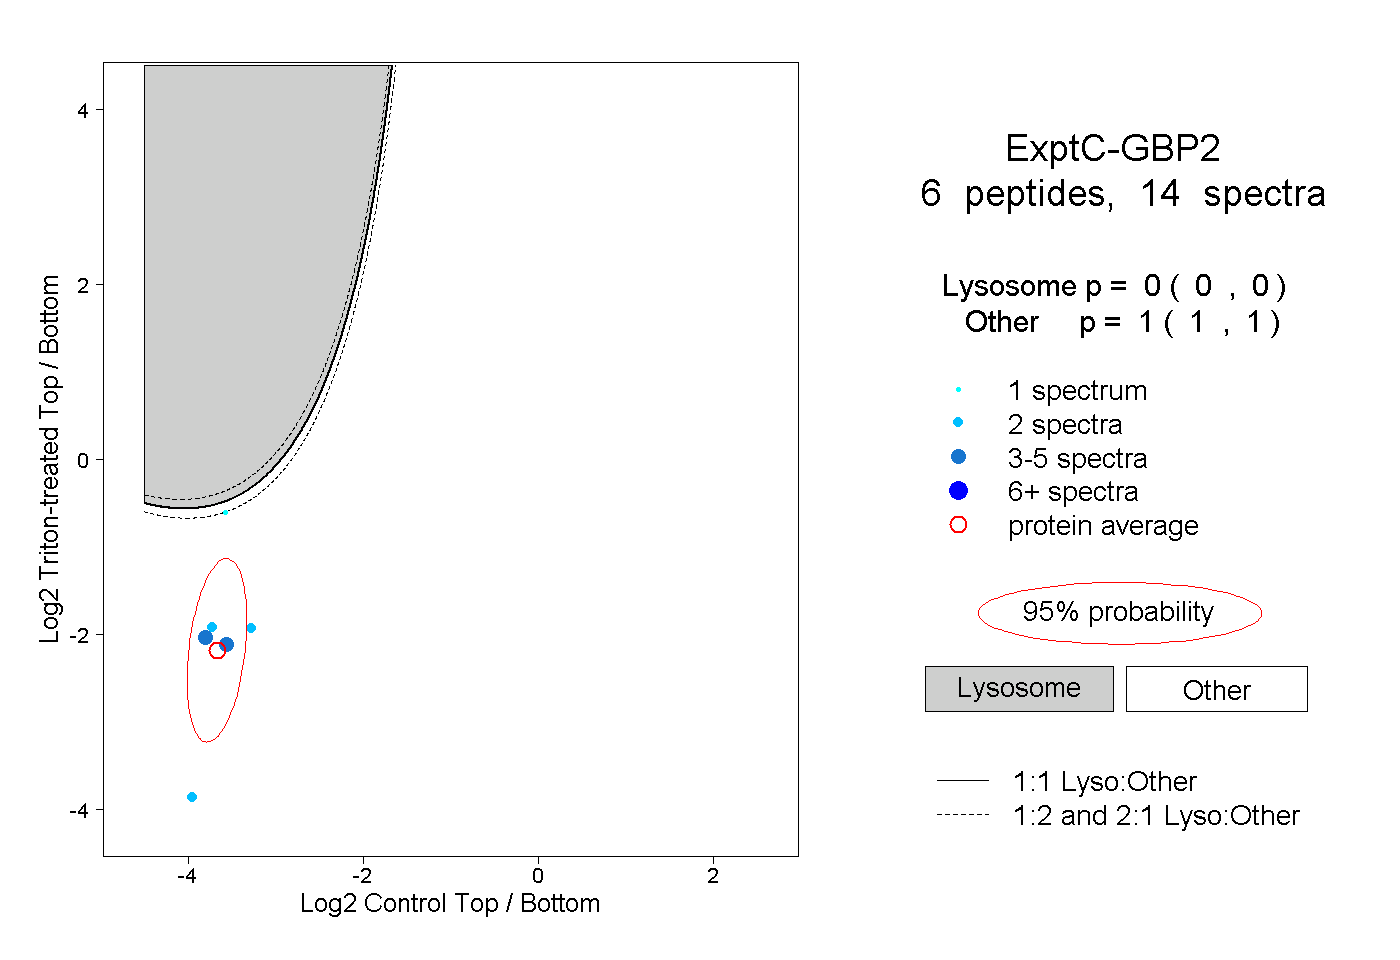 |
0.000 0.000 | 0.000 |
1.000 1.000 | 1.000 |
||||||||
| Plot | Lyso | Other | |||||||||||
| Expt D |
1 peptide |
2 spectra |
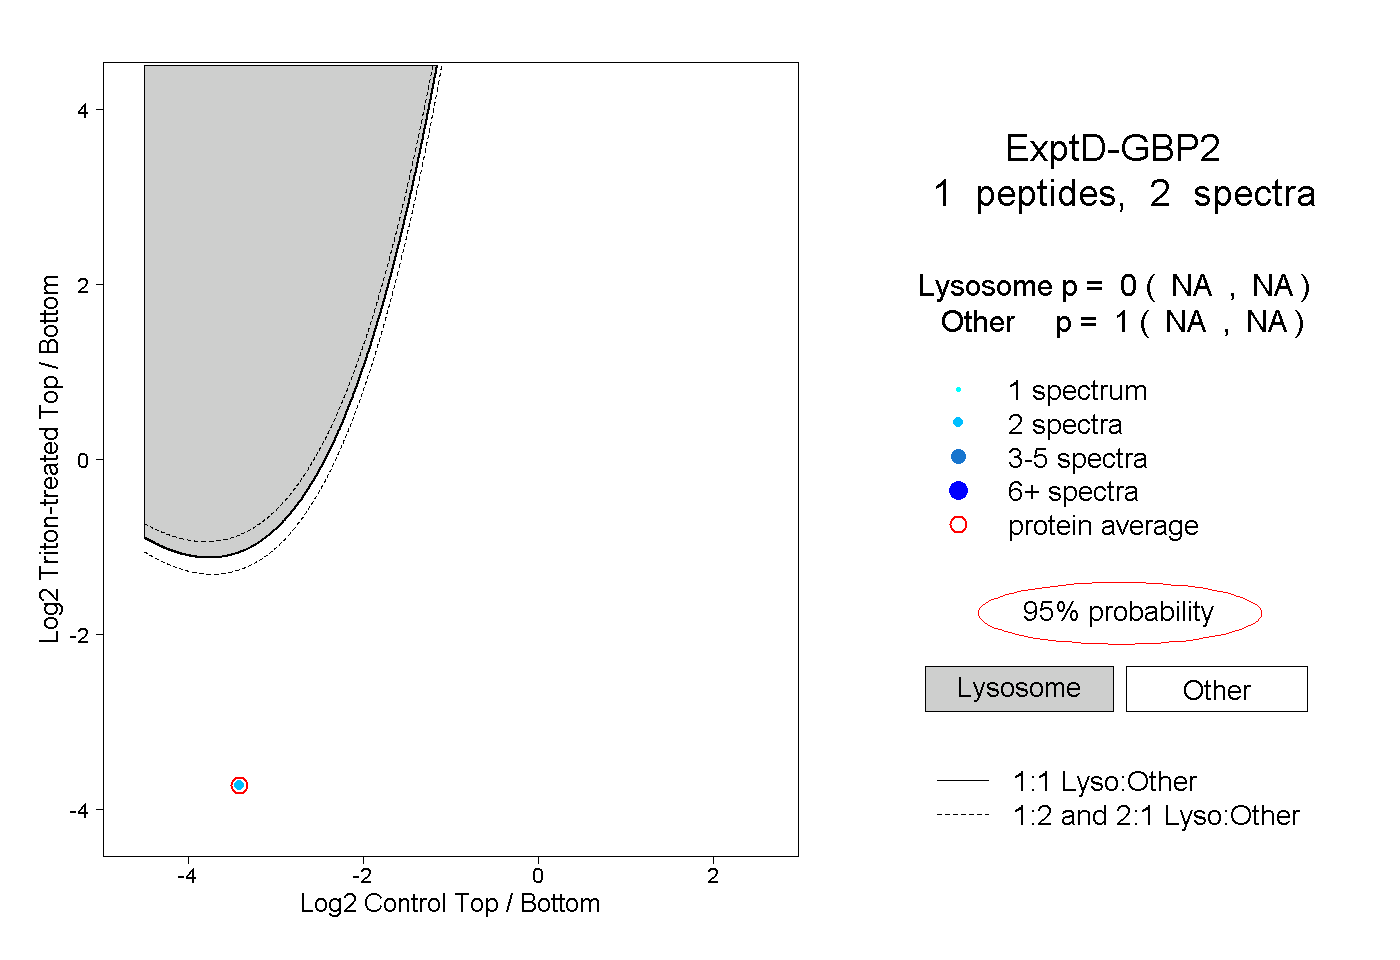 |
0.000 NA | NA |
1.000 NA | NA |