 2
2peptides
spectra
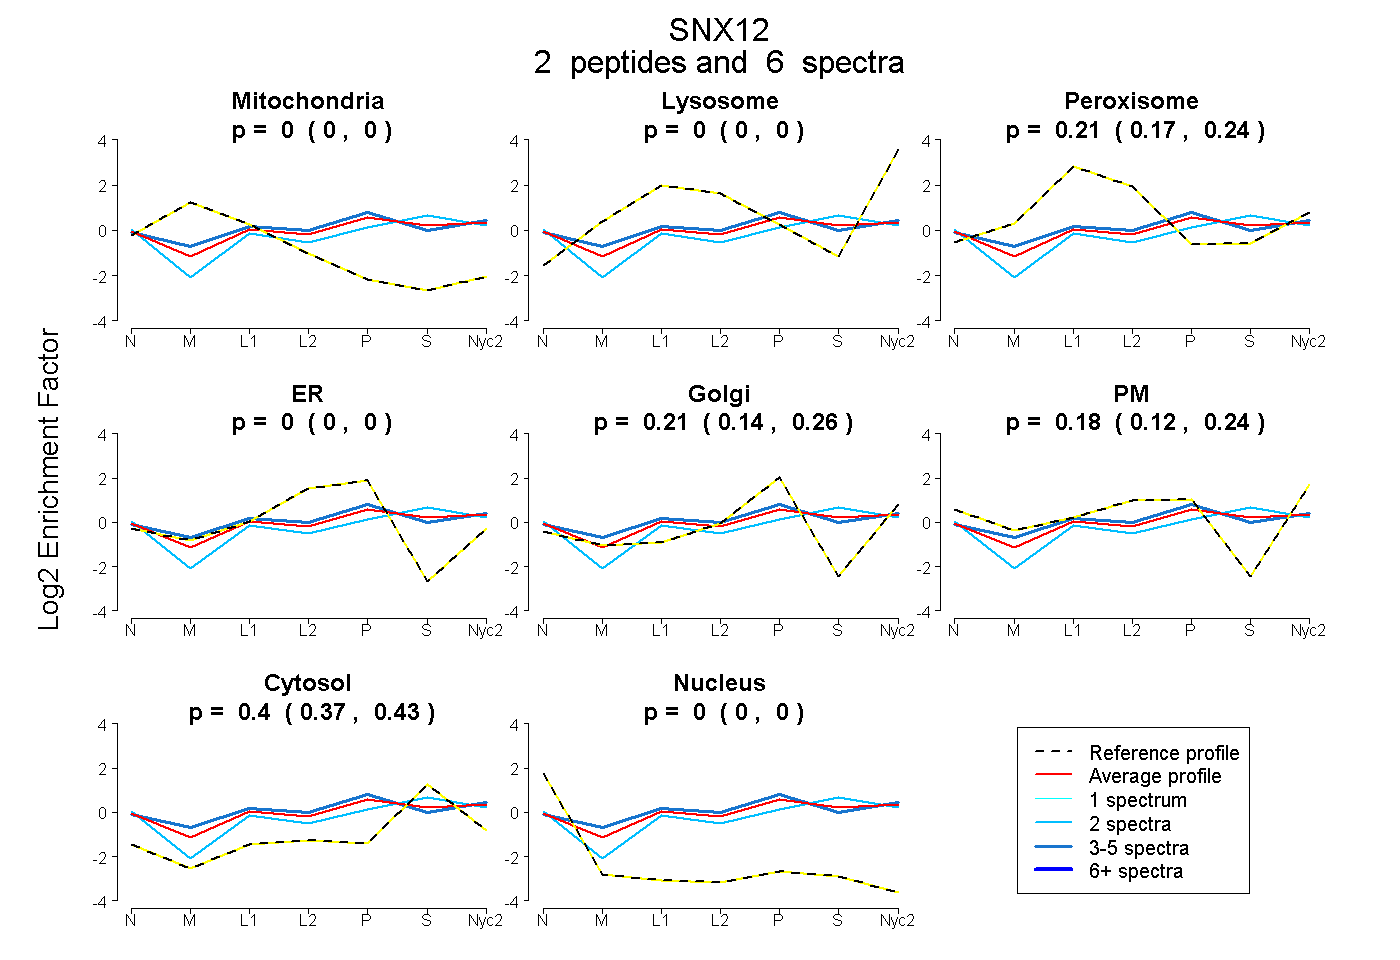
0.000 | 0.000
0.000 | 0.000
0.175 | 0.241
0.000 | 0.000
0.135 | 0.263
0.117 | 0.240
0.369 | 0.431
0.000 | 0.000
1peptide
spectra
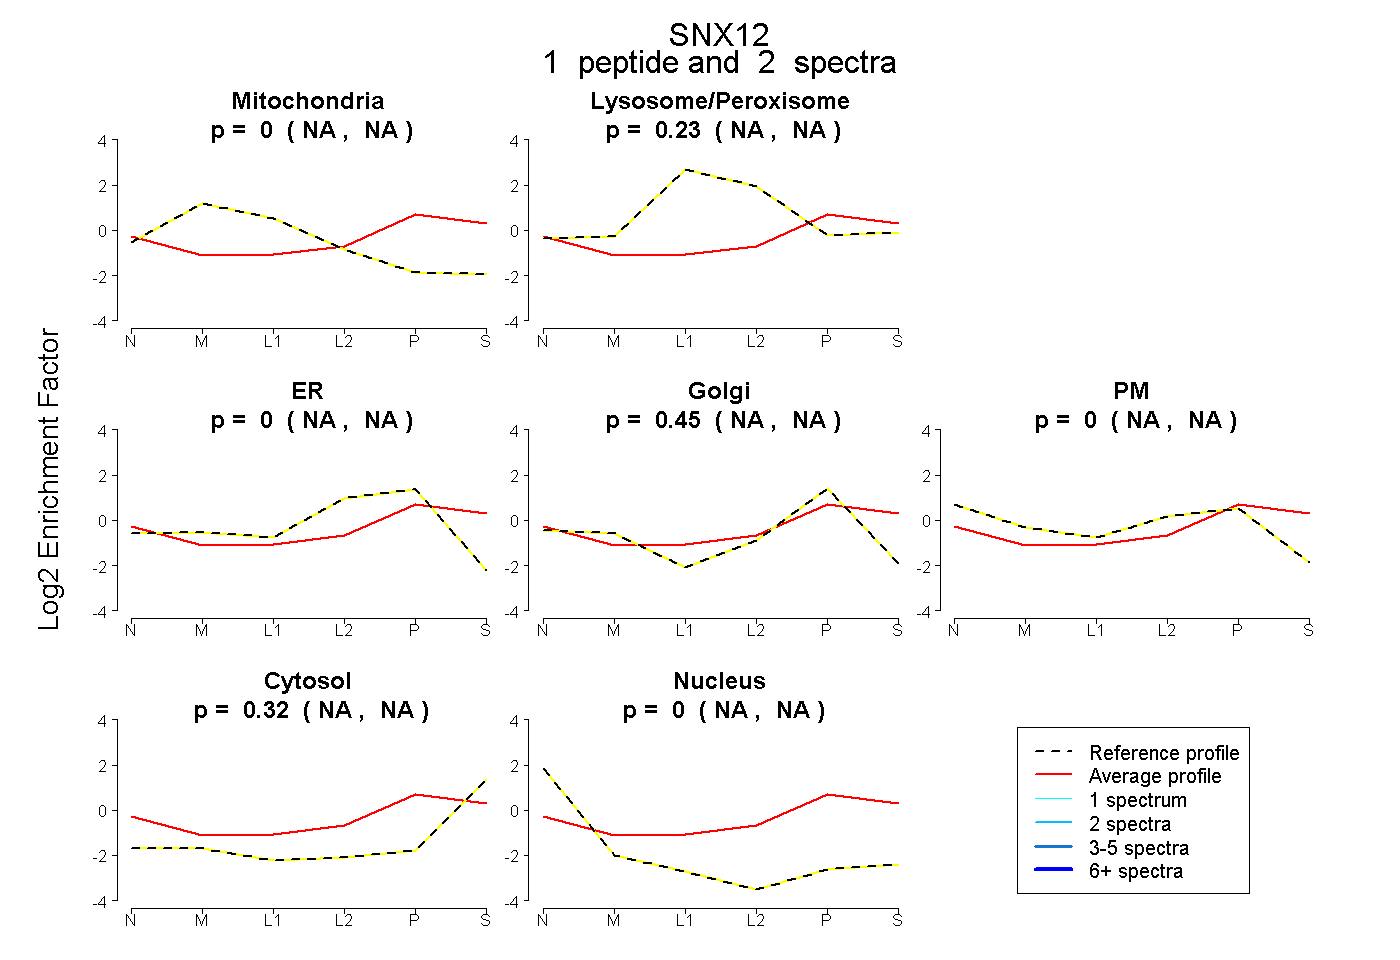
NA | NA
NA | NA
NA | NA
NA | NA
NA | NA
NA | NA
NA | NA
6peptides
spectra
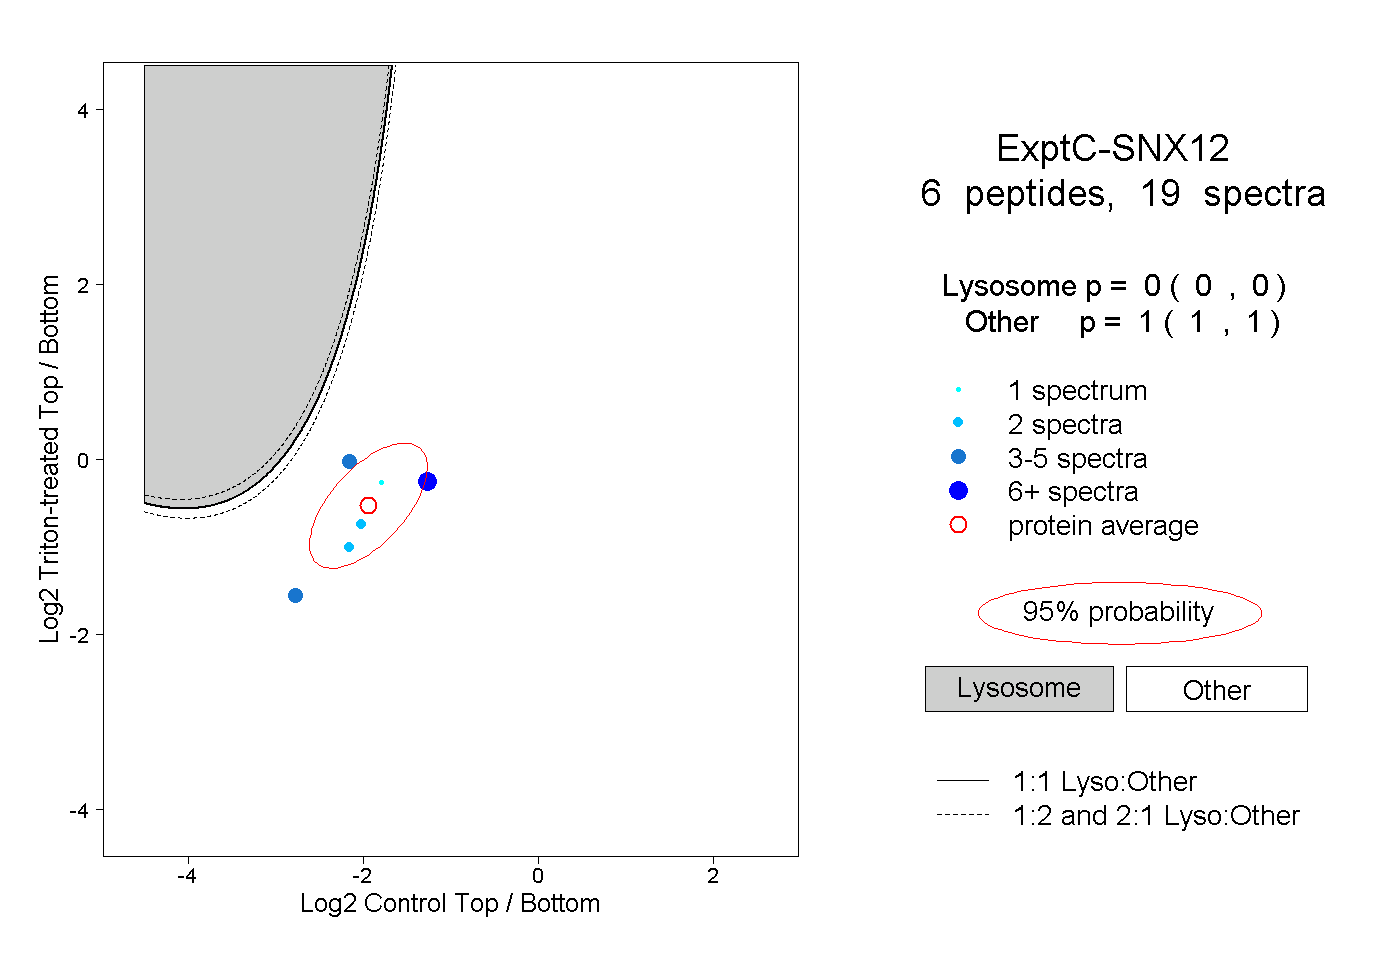
0.000 | 0.000
1.000 | 1.000
1peptide
spectrum
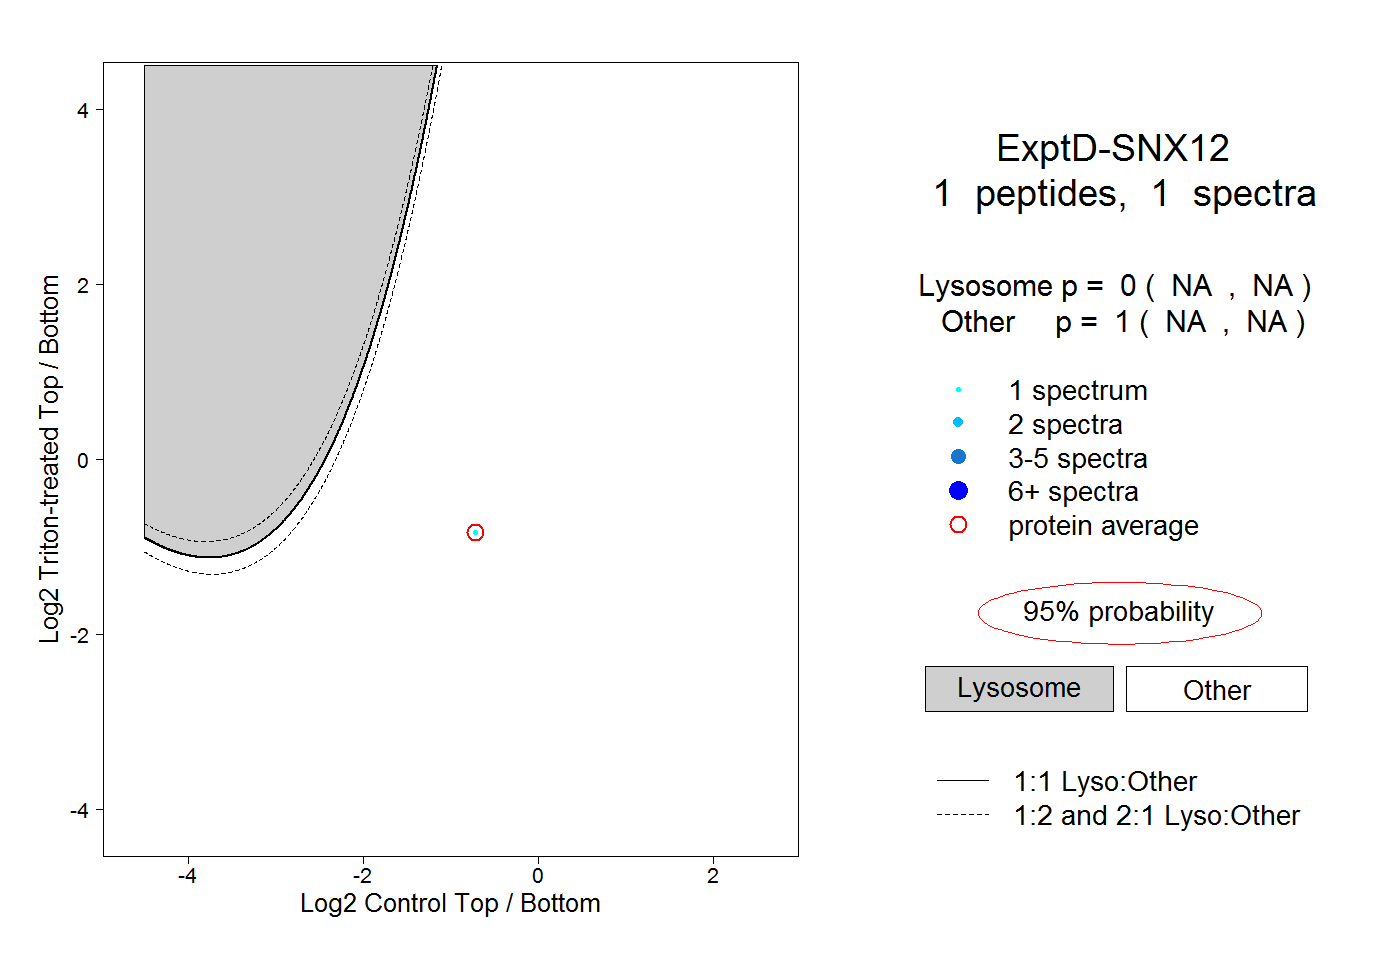
NA | NA
NA | NA