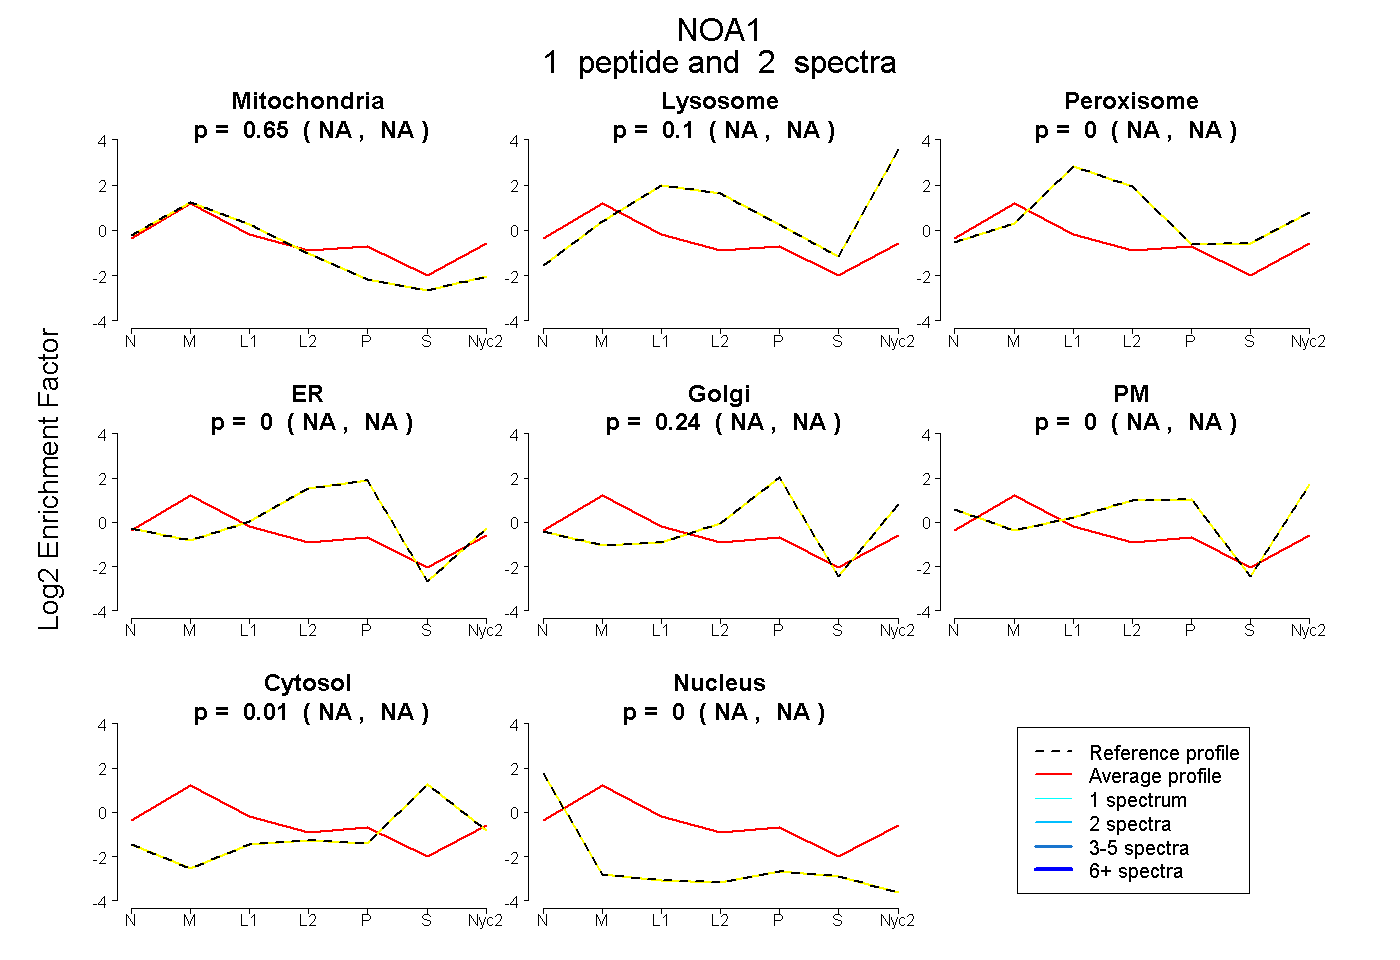
 1
1peptide
spectra
NA | NA
NA | NA
NA | NA
NA | NA
NA | NA
NA | NA
NA | NA
NA | NA
2peptides
spectra
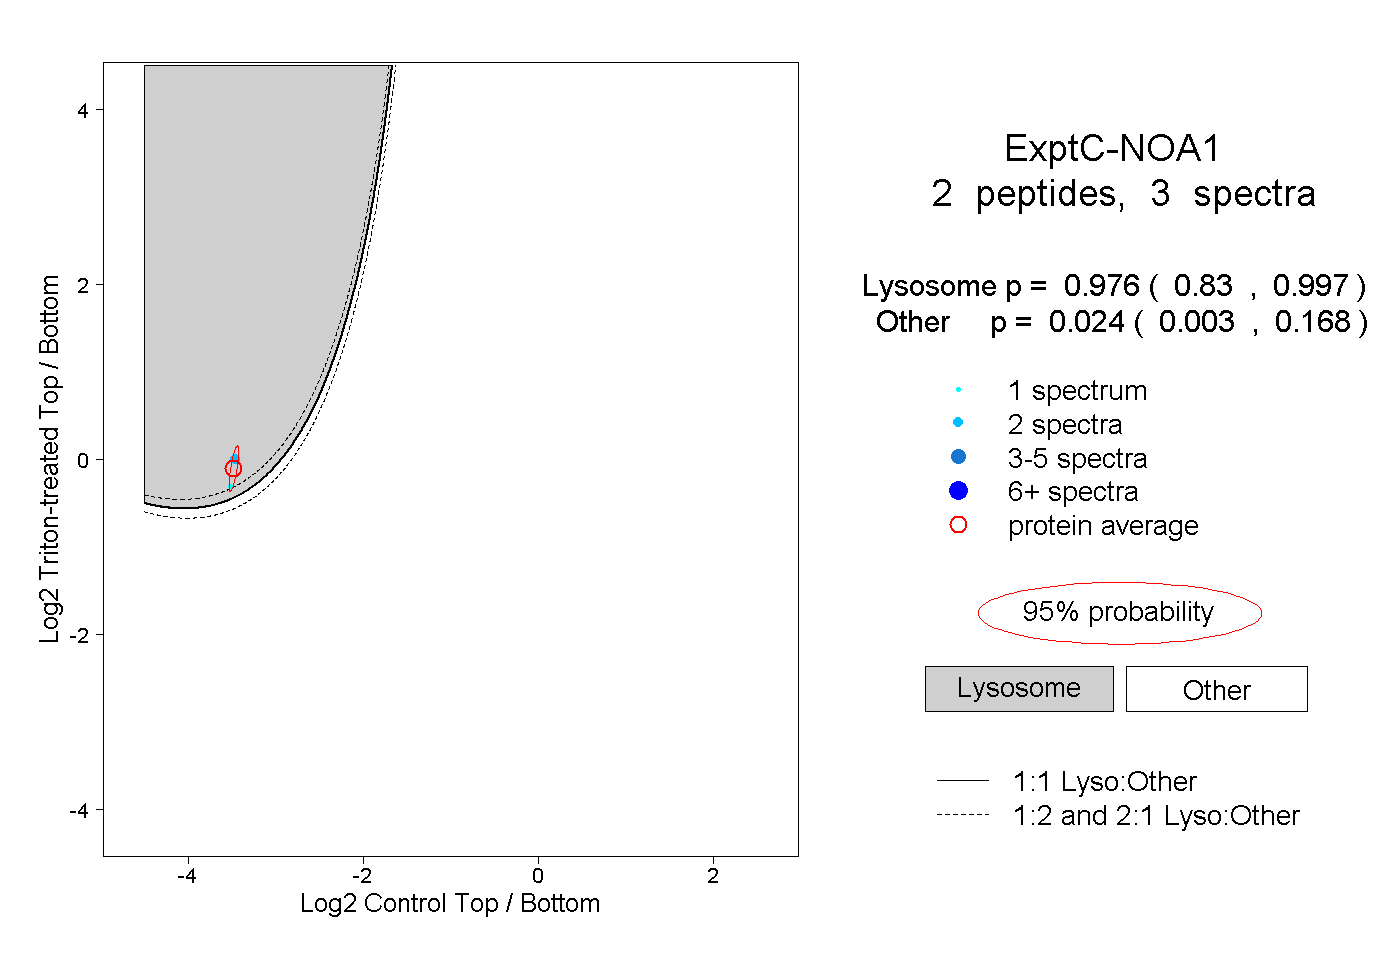
0.830 | 0.997
0.003 | 0.168
| Plot | Mito | Lyso | Perox | ER | Golgi | PM | Cytosol | Nucleus | |||||
| Expt A |
1 peptide |
2 spectra |
|
0.646 NA | NA |
0.097 NA | NA |
0.000 NA | NA |
0.000 NA | NA |
0.243 NA | NA |
0.000 NA | NA |
0.013 NA | NA |
0.000 NA | NA |
||
| Plot | Lyso | Other | |||||||||||
| Expt C |
2 peptides |
3 spectra |
|
0.976 0.830 | 0.997 |
0.024 0.003 | 0.168 |