36
36peptides
spectra
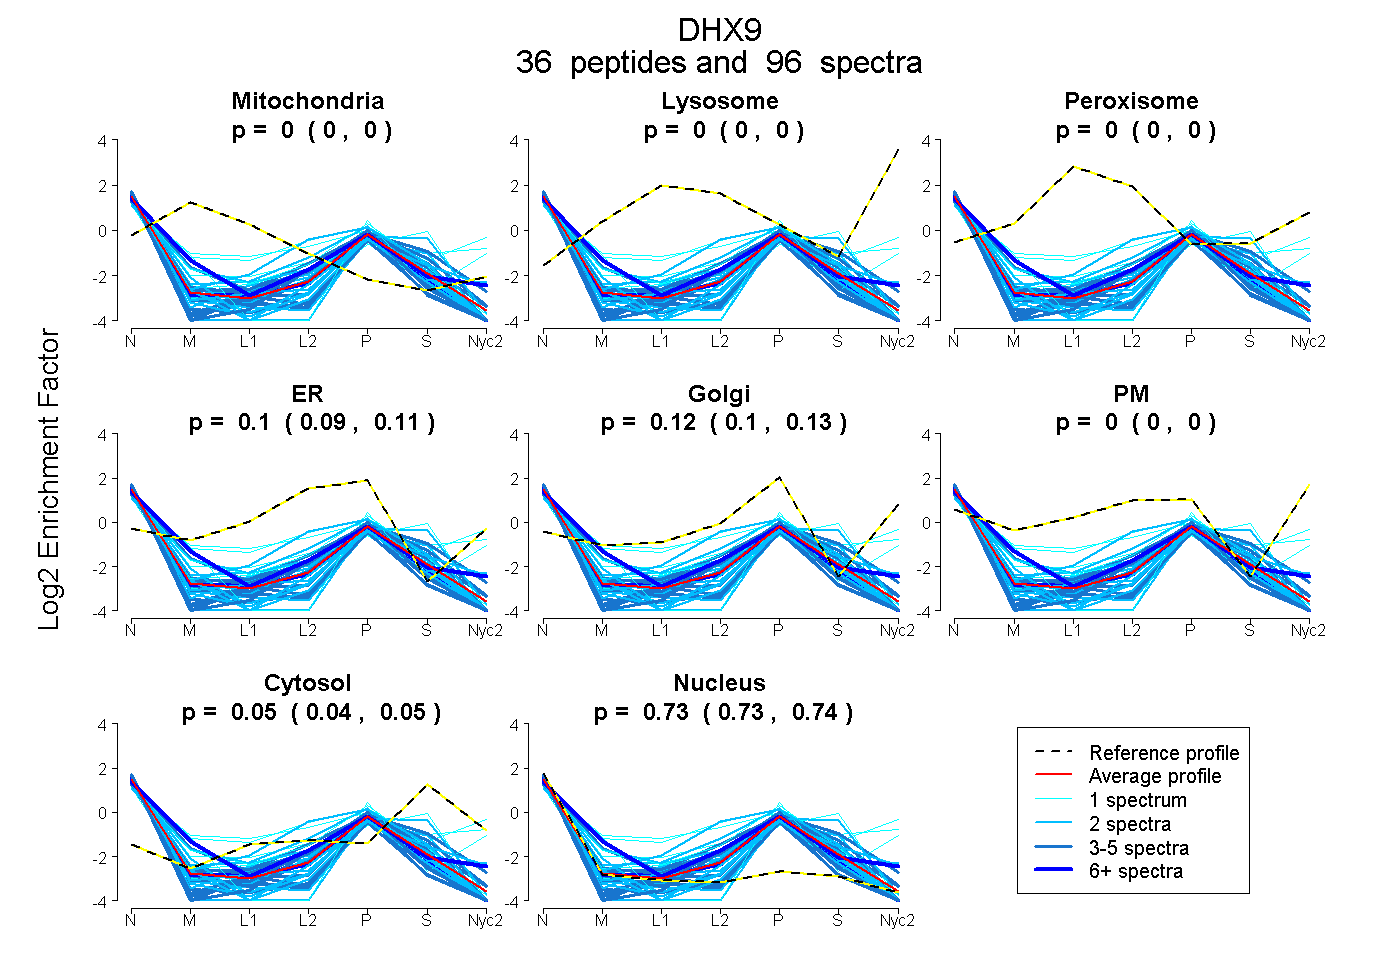
0.000 | 0.000
0.000 | 0.000
0.000 | 0.000
0.091 | 0.113
0.104 | 0.127
0.000 | 0.000
0.043 | 0.050
0.731 | 0.736
14peptides
spectra
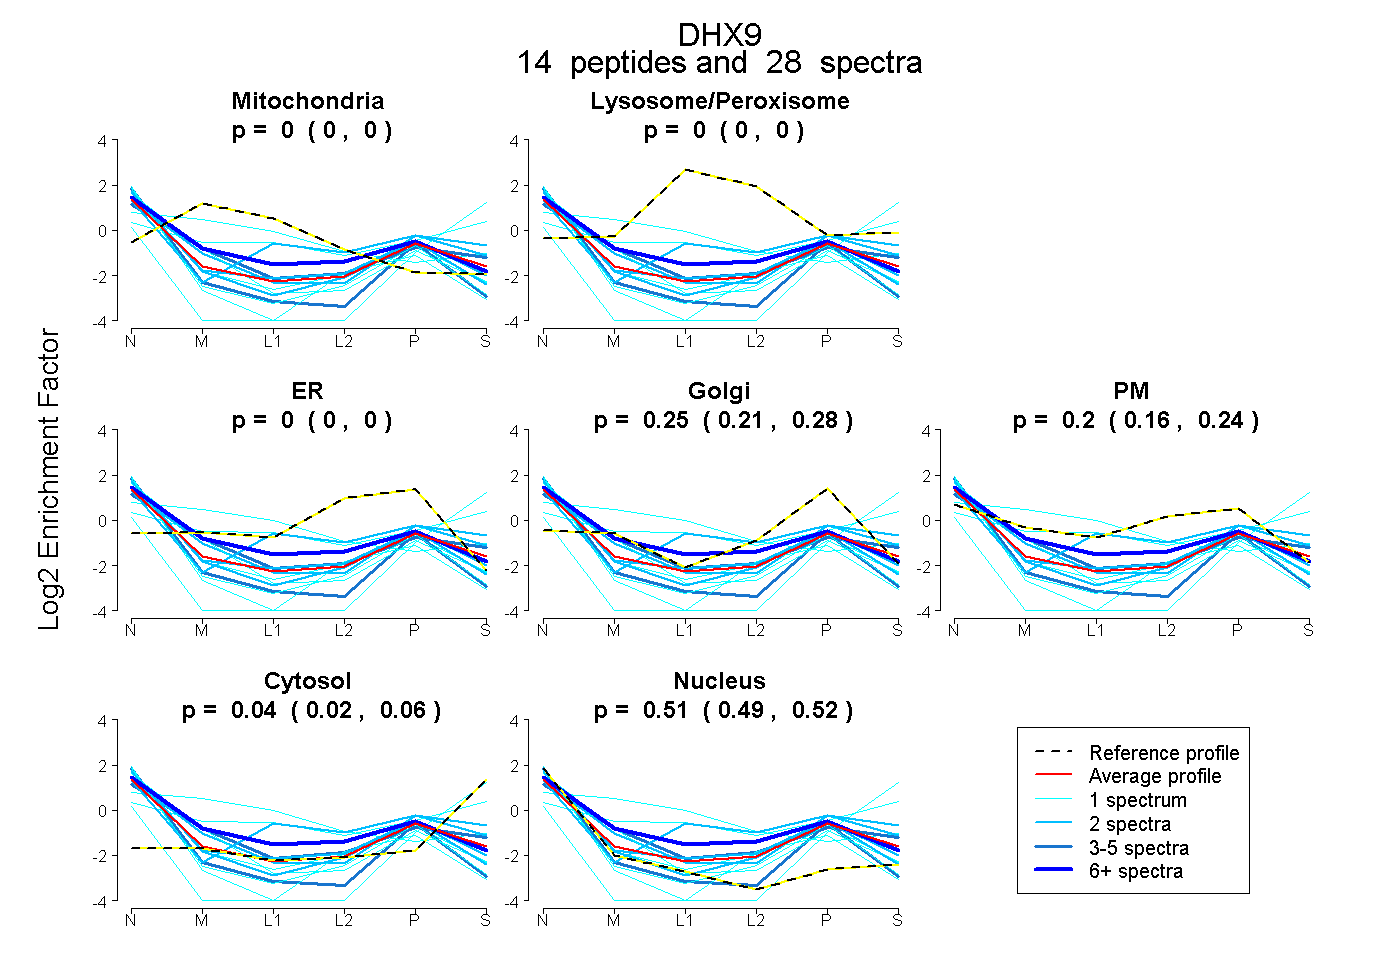
0.000 | 0.000
0.000 | 0.000
0.000 | 0.000
0.209 | 0.281
0.160 | 0.237
0.021 | 0.060
0.491 | 0.523