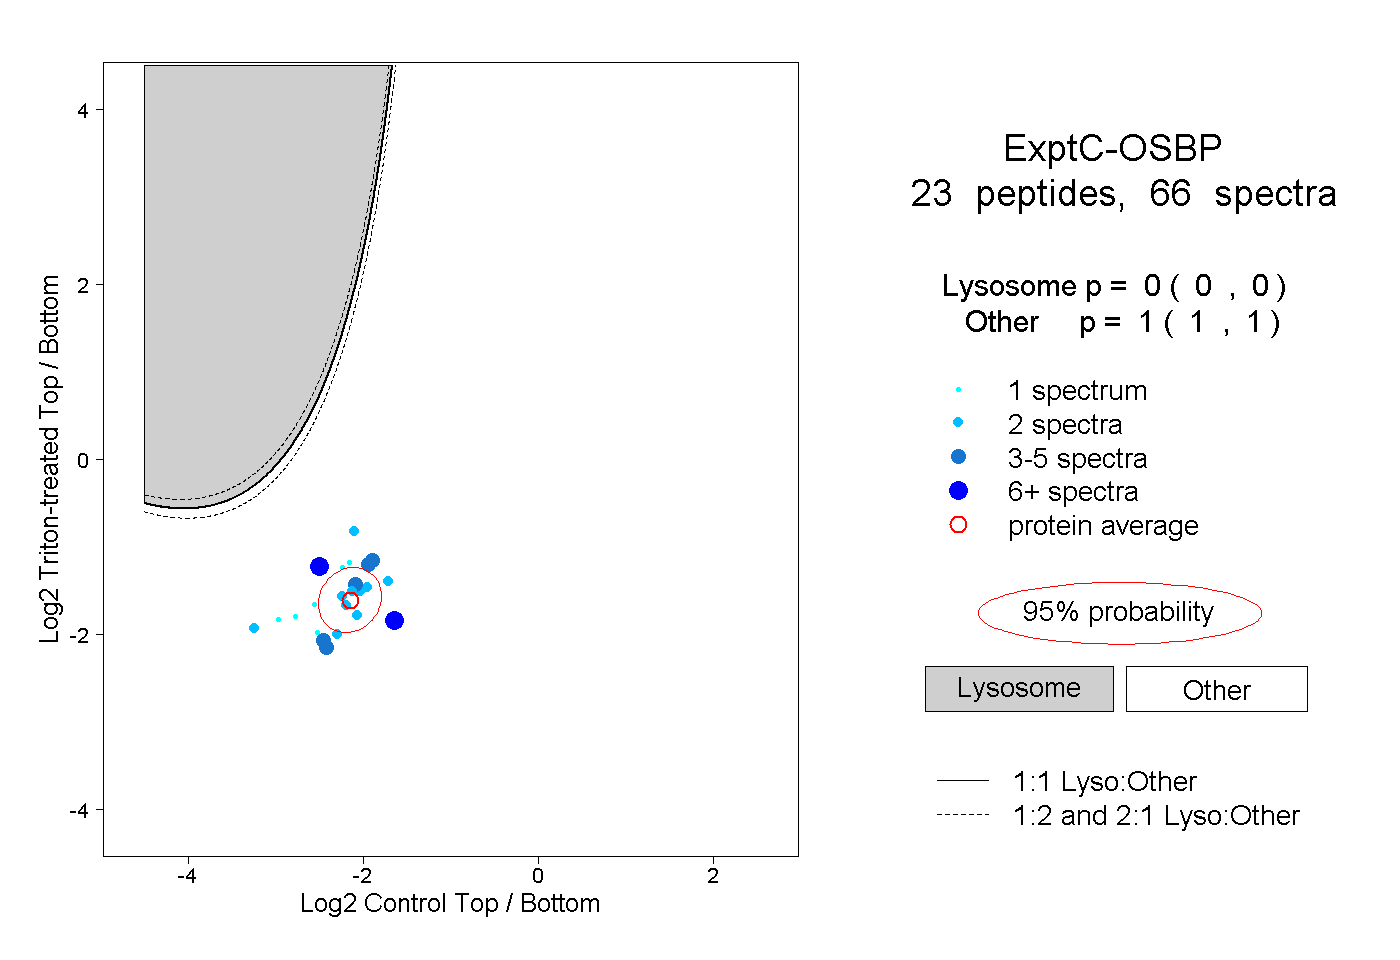
23
23peptides
spectra
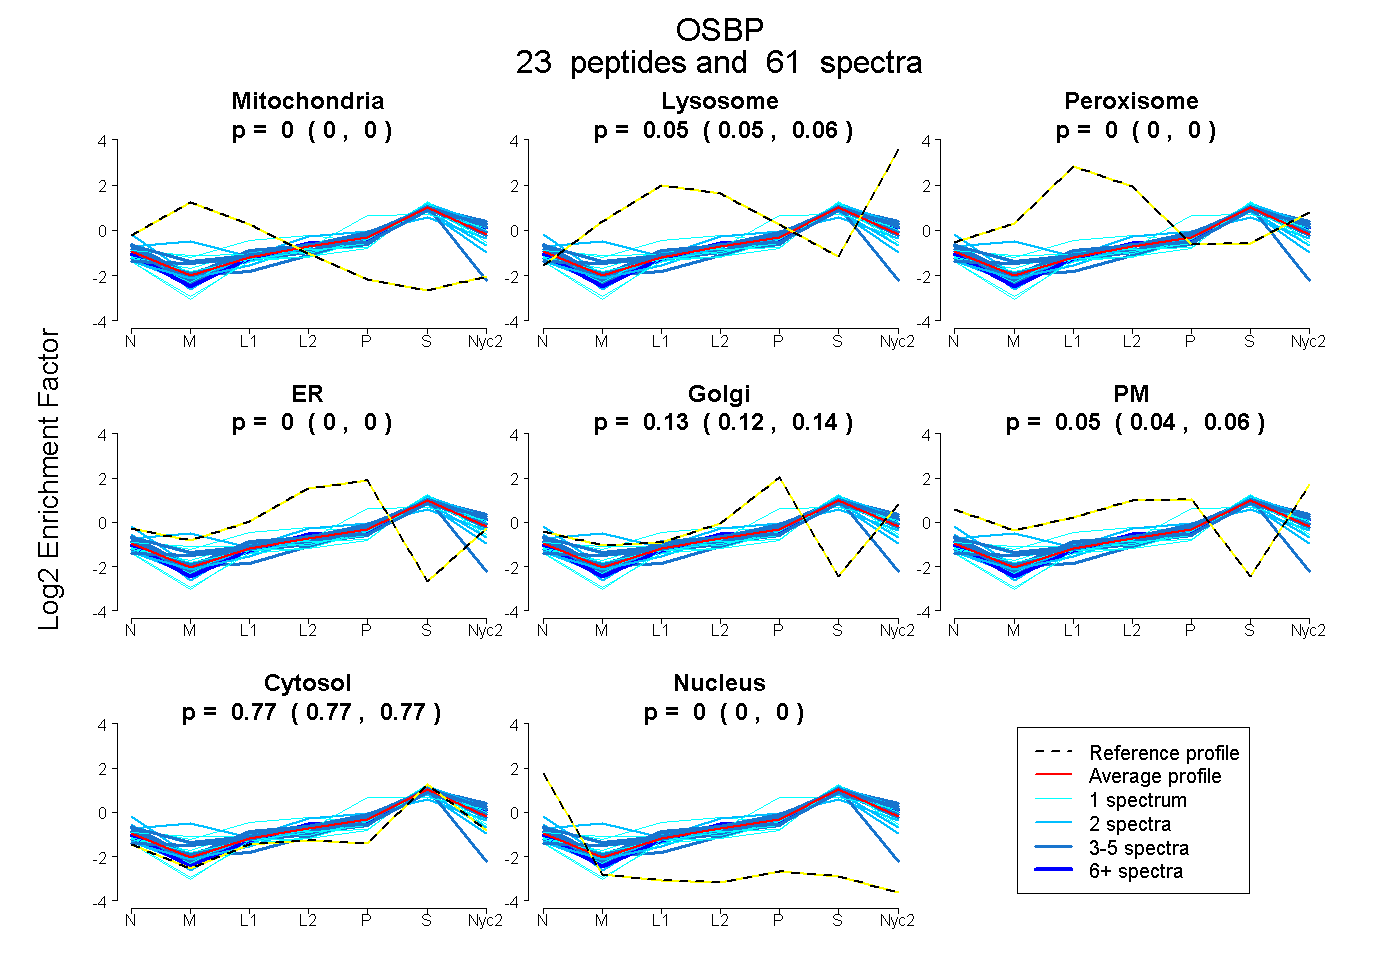
0.000 | 0.000
0.046 | 0.057
0.000 | 0.001
0.000 | 0.000
0.122 | 0.136
0.040 | 0.059
0.765 | 0.771
0.000 | 0.000
5peptides
spectra
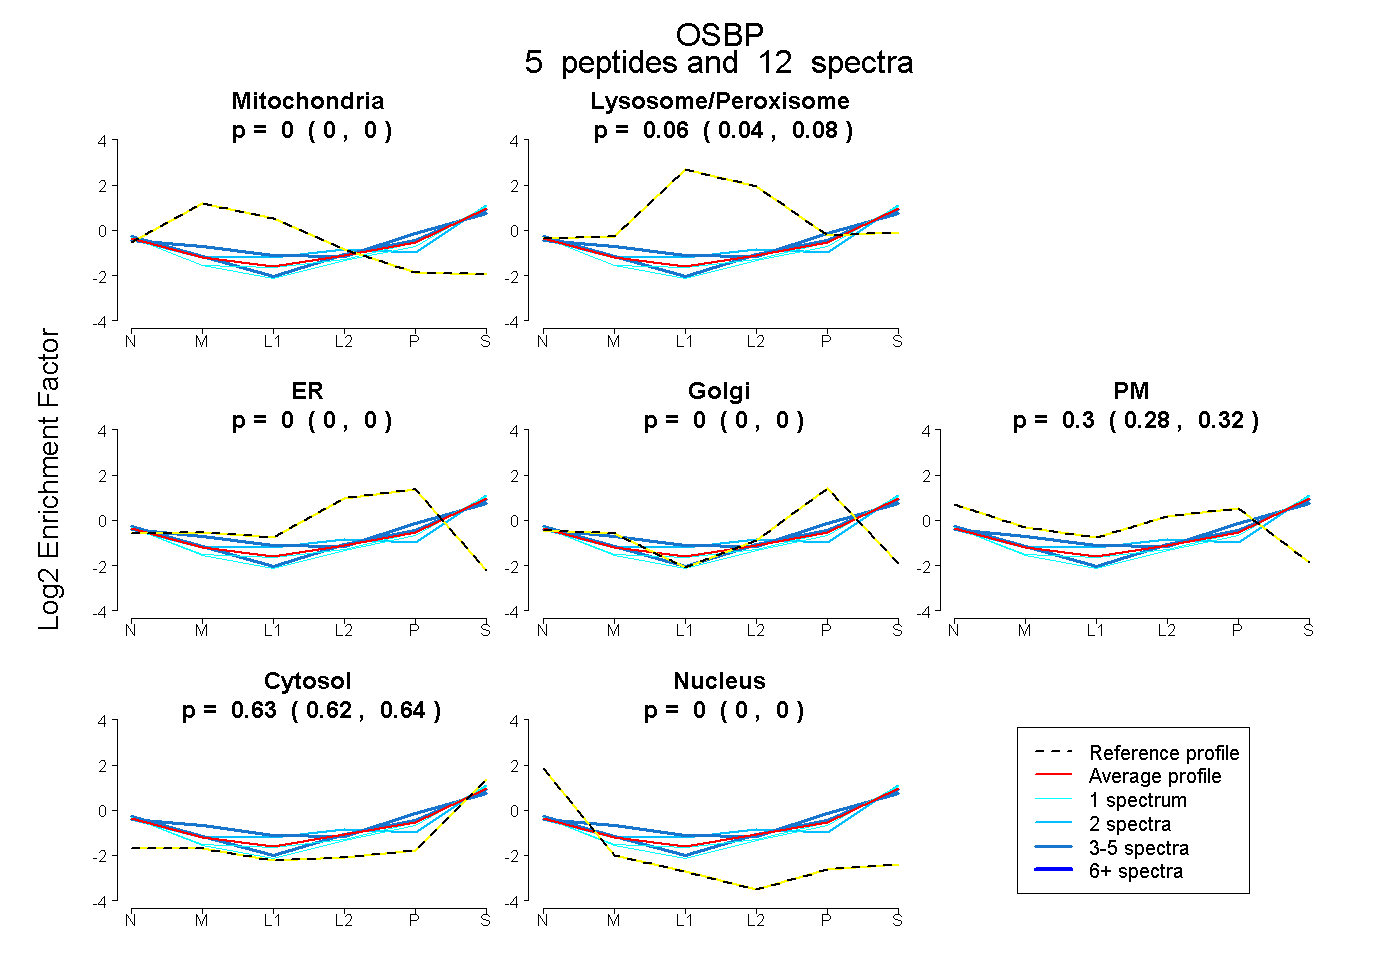
0.000 | 0.000
0.041 | 0.083
0.000 | 0.000
0.000 | 0.000
0.282 | 0.319
0.623 | 0.644
0.000 | 0.000