 23
23peptides
spectra
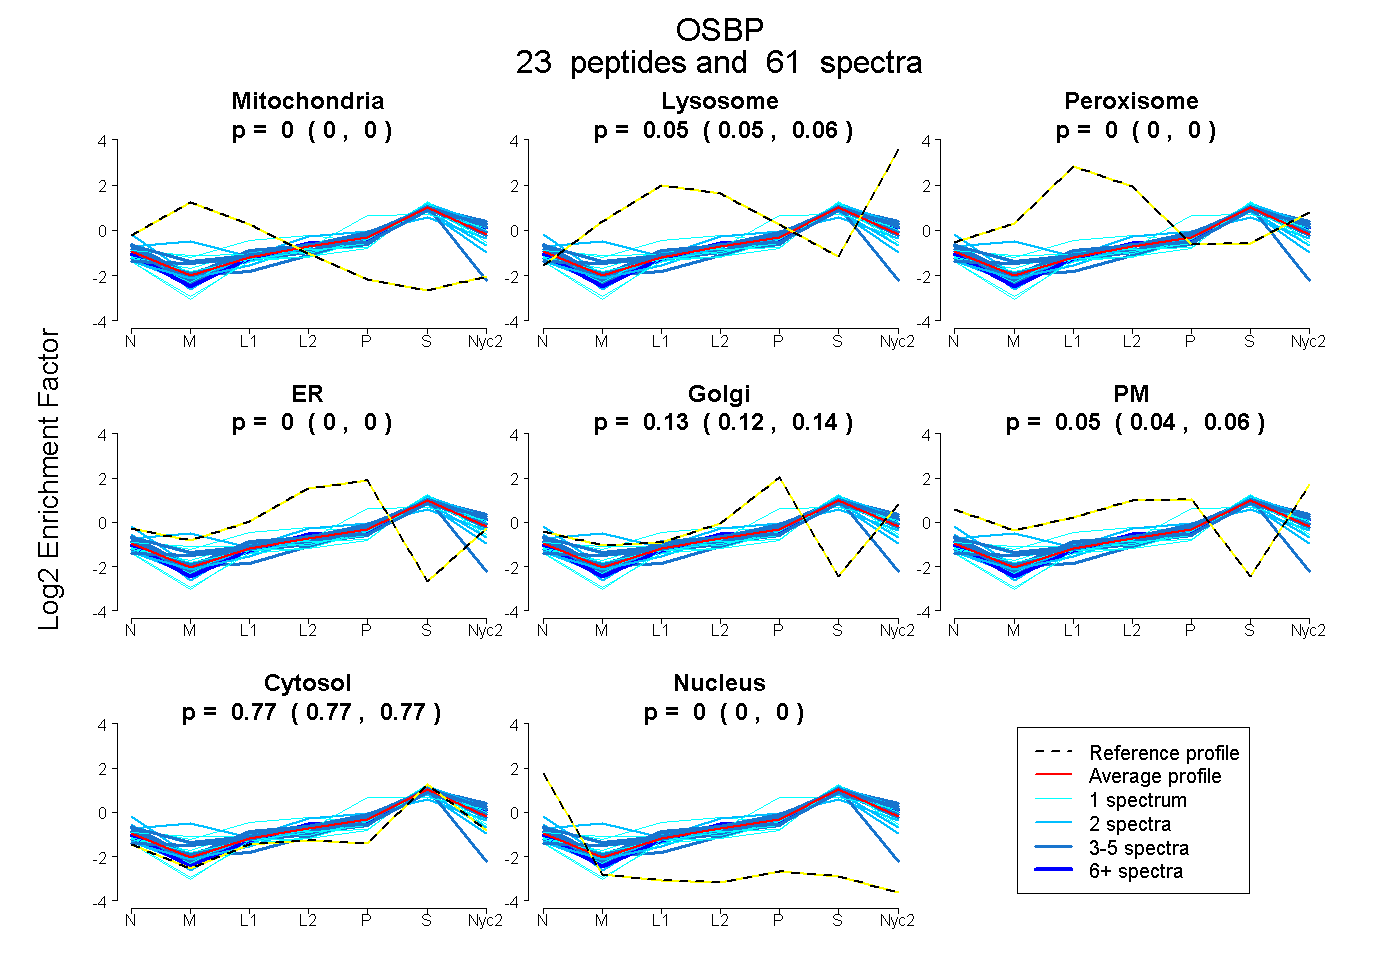
0.000 | 0.000
0.046 | 0.057
0.000 | 0.001
0.000 | 0.000
0.122 | 0.136
0.040 | 0.059
0.765 | 0.771
0.000 | 0.000
| Plot | Mito | Lyso | Perox | ER | Golgi | PM | Cytosol | Nucleus | |||||
| Expt A |
23 peptides |
61 spectra |
|
0.000 0.000 | 0.000 |
0.052 0.046 | 0.057 |
0.000 0.000 | 0.001 |
0.000 0.000 | 0.000 |
0.129 0.122 | 0.136 |
0.050 0.040 | 0.059 |
0.768 0.765 | 0.771 |
0.000 0.000 | 0.000 |
| 3 spectra, WDEANAEK | 0.000 | 0.090 | 0.000 | 0.000 | 0.000 | 0.201 | 0.709 | 0.000 | ||
| 1 spectrum, VHFALLGTWDEK | 0.000 | 0.000 | 0.000 | 0.000 | 0.061 | 0.000 | 0.939 | 0.000 | ||
| 3 spectra, FVPYSYFSR | 0.000 | 0.095 | 0.000 | 0.000 | 0.167 | 0.000 | 0.738 | 0.000 | ||
| 2 spectra, HQLEETK | 0.000 | 0.040 | 0.000 | 0.000 | 0.000 | 0.235 | 0.725 | 0.000 | ||
| 4 spectra, LEETLEQLAK | 0.000 | 0.000 | 0.000 | 0.000 | 0.215 | 0.000 | 0.785 | 0.000 | ||
| 3 spectra, WVTALELAK | 0.000 | 0.156 | 0.000 | 0.000 | 0.114 | 0.000 | 0.729 | 0.000 | ||
| 4 spectra, ITSNAMINACR | 0.019 | 0.000 | 0.000 | 0.168 | 0.000 | 0.000 | 0.781 | 0.032 | ||
| 1 spectrum, VTTTVHNIIVGK | 0.000 | 0.084 | 0.000 | 0.000 | 0.346 | 0.000 | 0.570 | 0.000 | ||
| 1 spectrum, VMLWK | 0.000 | 0.104 | 0.000 | 0.000 | 0.096 | 0.000 | 0.799 | 0.000 | ||
| 3 spectra, ALWFER | 0.000 | 0.093 | 0.000 | 0.000 | 0.078 | 0.000 | 0.829 | 0.000 | ||
| 3 spectra, ELTHVYR | 0.000 | 0.047 | 0.000 | 0.000 | 0.174 | 0.000 | 0.780 | 0.000 | ||
| 2 spectra, GEYWECK | 0.061 | 0.000 | 0.149 | 0.000 | 0.255 | 0.000 | 0.535 | 0.000 | ||
| 2 spectra, HGTALQR | 0.000 | 0.000 | 0.000 | 0.179 | 0.051 | 0.008 | 0.718 | 0.044 | ||
| 4 spectra, QHNHLER | 0.000 | 0.066 | 0.000 | 0.000 | 0.077 | 0.163 | 0.694 | 0.000 | ||
| 2 spectra, EQCCSGK | 0.000 | 0.000 | 0.000 | 0.190 | 0.039 | 0.000 | 0.771 | 0.000 | ||
| 1 spectrum, LPAESNEK | 0.000 | 0.104 | 0.000 | 0.000 | 0.093 | 0.000 | 0.803 | 0.000 | ||
| 1 spectrum, LWIDQSGEIDIVNHK | 0.000 | 0.199 | 0.000 | 0.000 | 0.008 | 0.000 | 0.793 | 0.000 | ||
| 5 spectra, SLSELESLK | 0.000 | 0.095 | 0.000 | 0.000 | 0.054 | 0.096 | 0.755 | 0.000 | ||
| 2 spectra, TSKPFNPLLGETFELDR | 0.000 | 0.097 | 0.000 | 0.000 | 0.118 | 0.000 | 0.785 | 0.000 | ||
| 10 spectra, LTEDLEYHELLDR | 0.000 | 0.091 | 0.000 | 0.000 | 0.125 | 0.000 | 0.784 | 0.000 | ||
| 1 spectrum, VEDLSTCNDLIAK | 0.000 | 0.000 | 0.000 | 0.000 | 0.097 | 0.000 | 0.903 | 0.000 | ||
| 2 spectra, DFLMLAQTHSK | 0.000 | 0.079 | 0.000 | 0.000 | 0.108 | 0.000 | 0.813 | 0.000 | ||
| 1 spectrum, ATEDGTPYDPYK | 0.000 | 0.000 | 0.257 | 0.010 | 0.082 | 0.014 | 0.636 | 0.000 |
| Plot | Mito | Lyso or Perox | ER | Golgi | PM | Cytosol | Nucleus | ||||||
| Expt B |
5 peptides |
12 spectra |
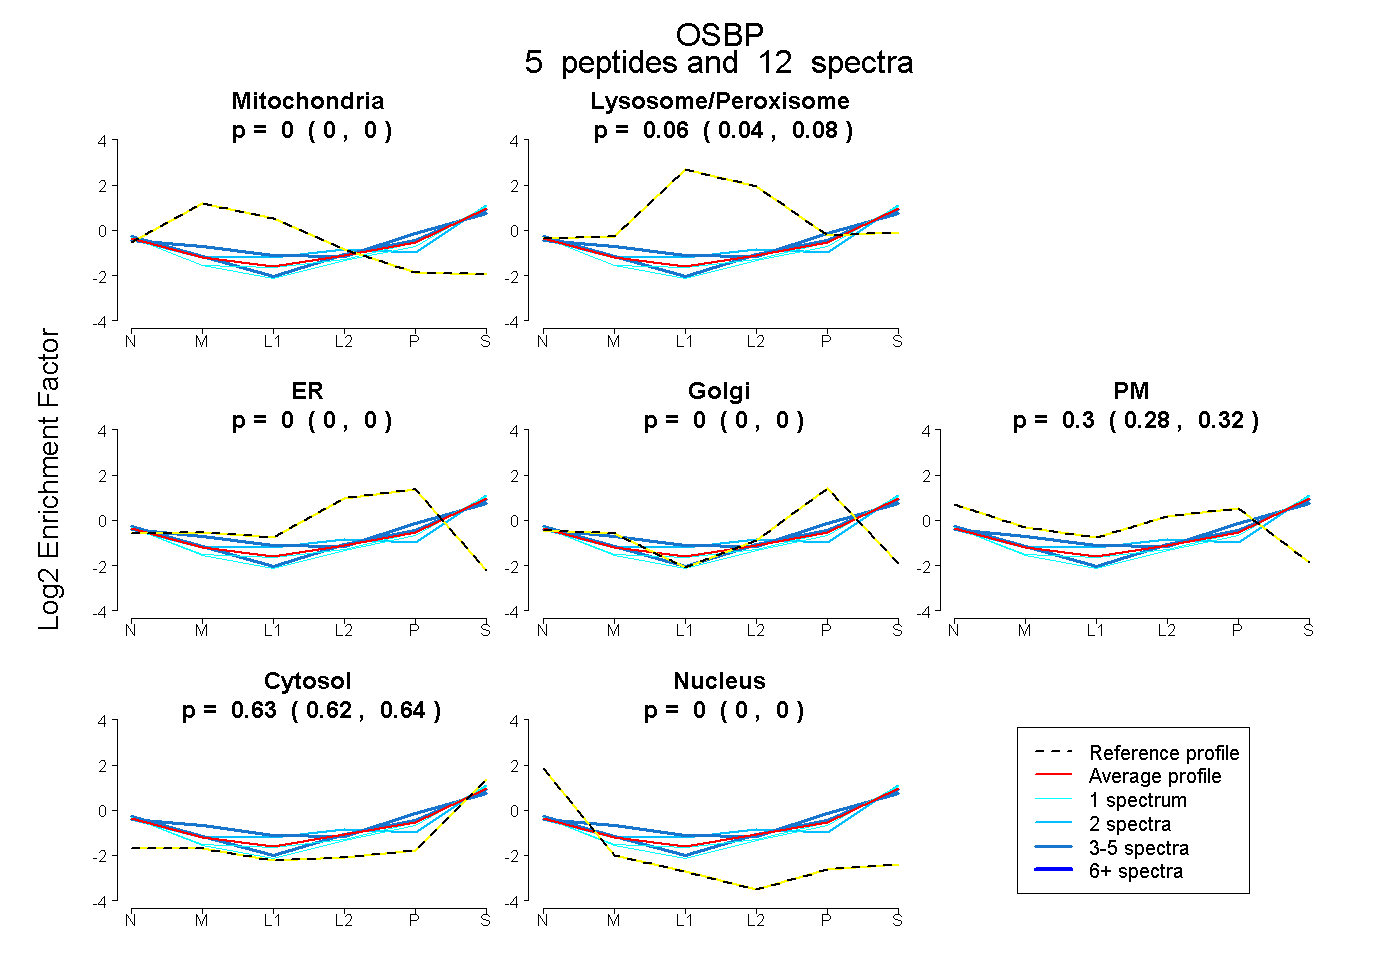 |
0.000 0.000 | 0.000 |
0.064 0.041 | 0.083 |
0.000 0.000 | 0.000 |
0.000 0.000 | 0.000 |
0.302 0.282 | 0.319 |
0.635 0.623 | 0.644 |
0.000 0.000 | 0.000 |
|||
| Plot | Lyso | Other | |||||||||||
| Expt C |
23 peptides |
66 spectra |
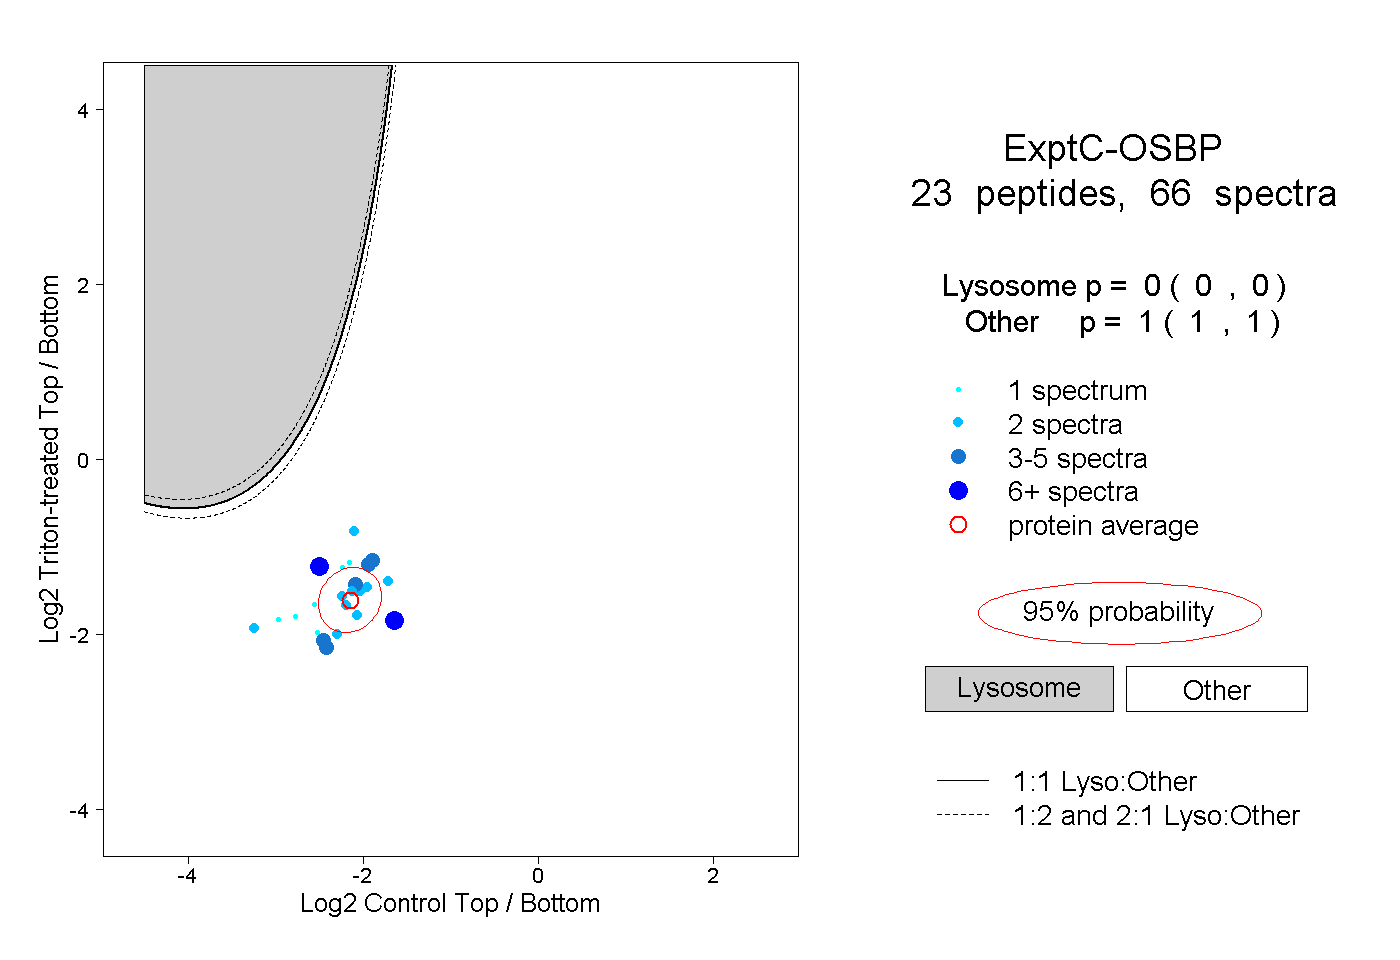 |
0.000 0.000 | 0.000 |
1.000 1.000 | 1.000 |
||||||||
| Plot | Lyso | Other | |||||||||||
| Expt D |
3 peptides |
4 spectra |
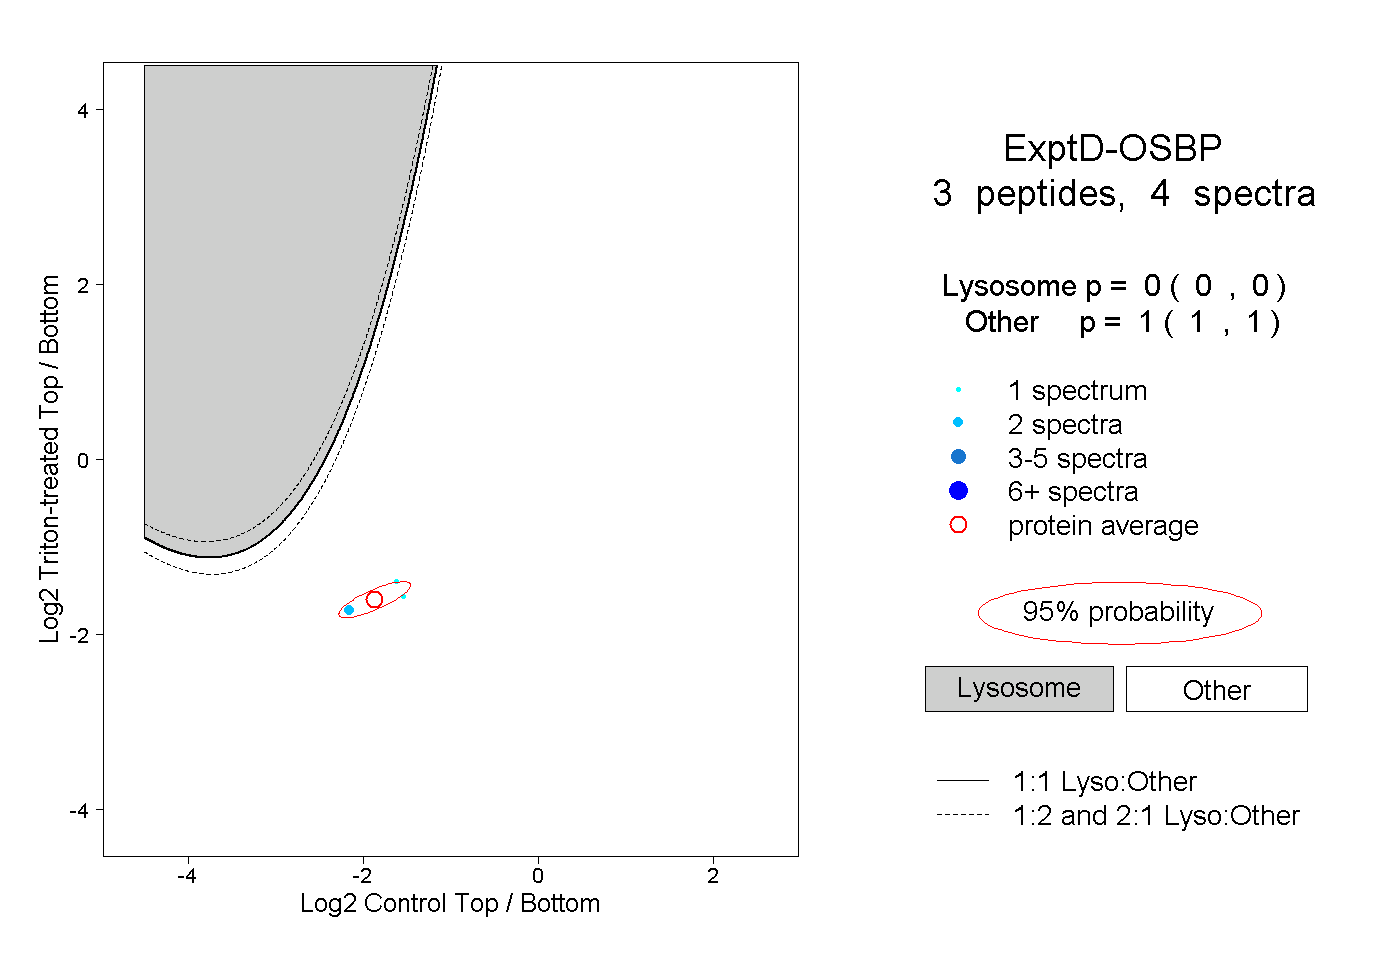 |
0.000 0.000 | 0.000 |
1.000 1.000 | 1.000 |