 3
3peptides
spectra
0.000 | 0.000
0.033 | 0.112
0.000 | 0.041
0.000 | 0.075
0.000 | 0.000
0.818 | 0.942
0.000 | 0.000
0.000 | 0.000
1peptide
spectra
0.000 | 0.000
1.000 | 1.000
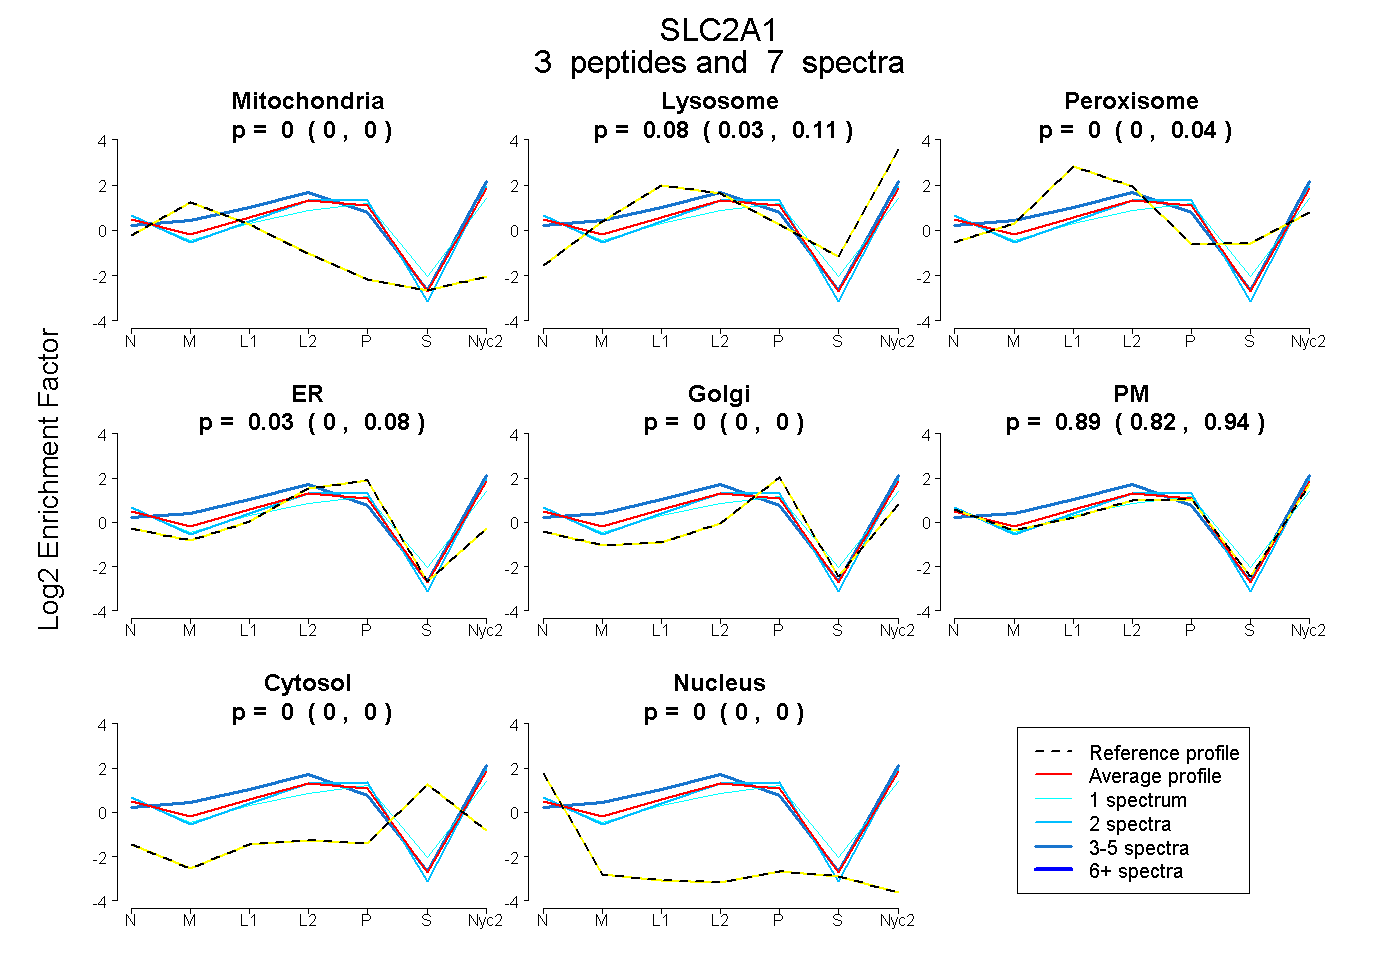
| Plot | Mito | Lyso | Perox | ER | Golgi | PM | Cytosol | Nucleus | |||||
| Expt A |
3 peptides |
7 spectra |
|
0.000 0.000 | 0.000 |
0.080 0.033 | 0.112 |
0.000 0.000 | 0.041 |
0.027 0.000 | 0.075 |
0.000 0.000 | 0.000 |
0.893 0.818 | 0.942 |
0.000 0.000 | 0.000 |
0.000 0.000 | 0.000 |
||
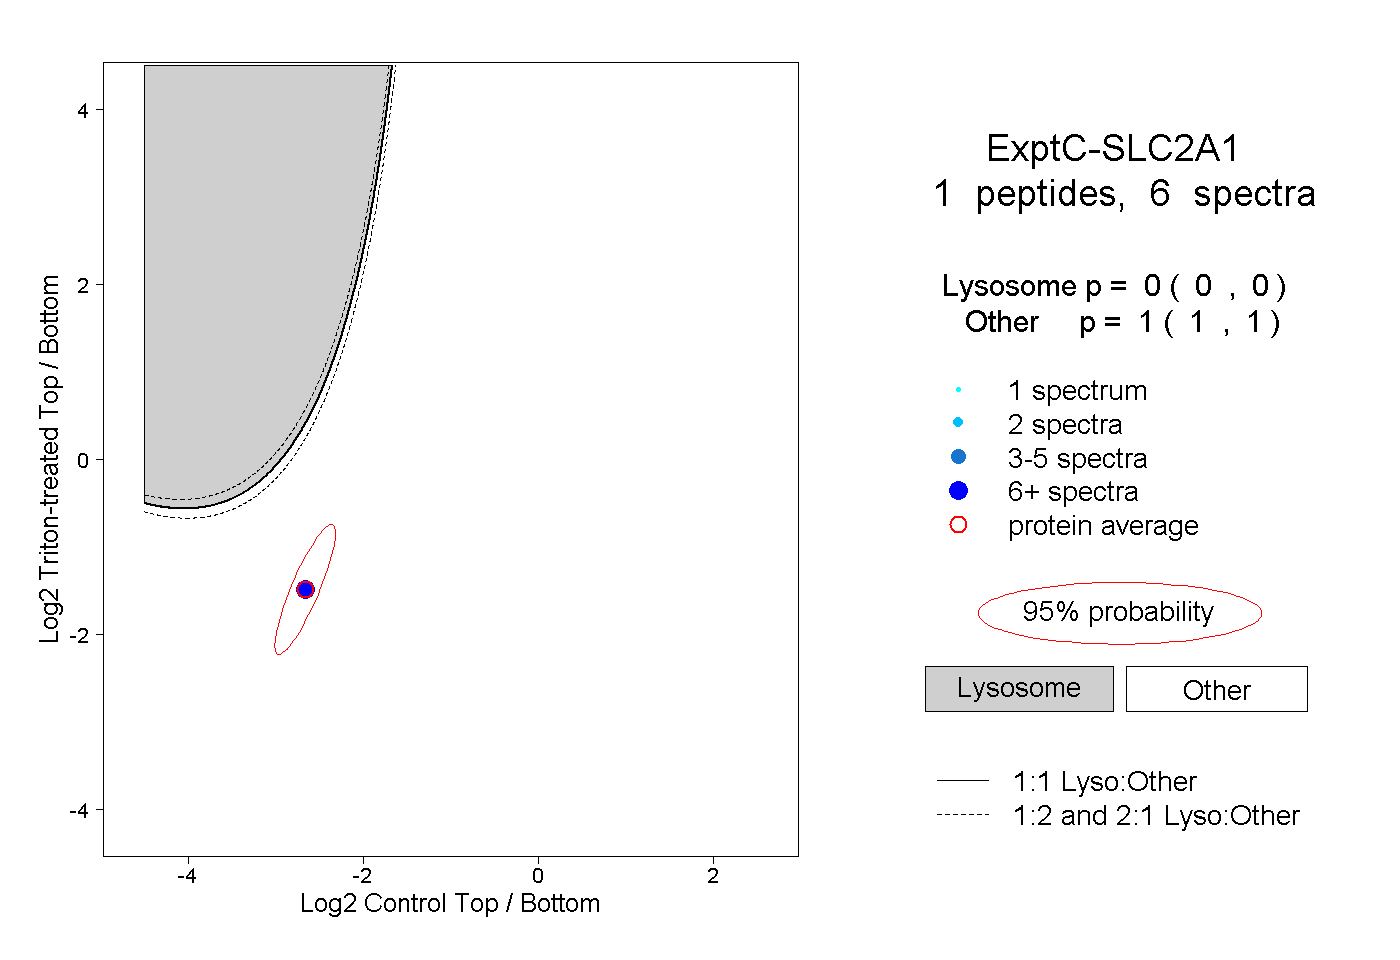
| Plot | Lyso | Other | |||||||||||
| Expt C |
1 peptide |
6 spectra |
|
0.000 0.000 | 0.000 |
1.000 1.000 | 1.000 |