9
9peptides
spectra
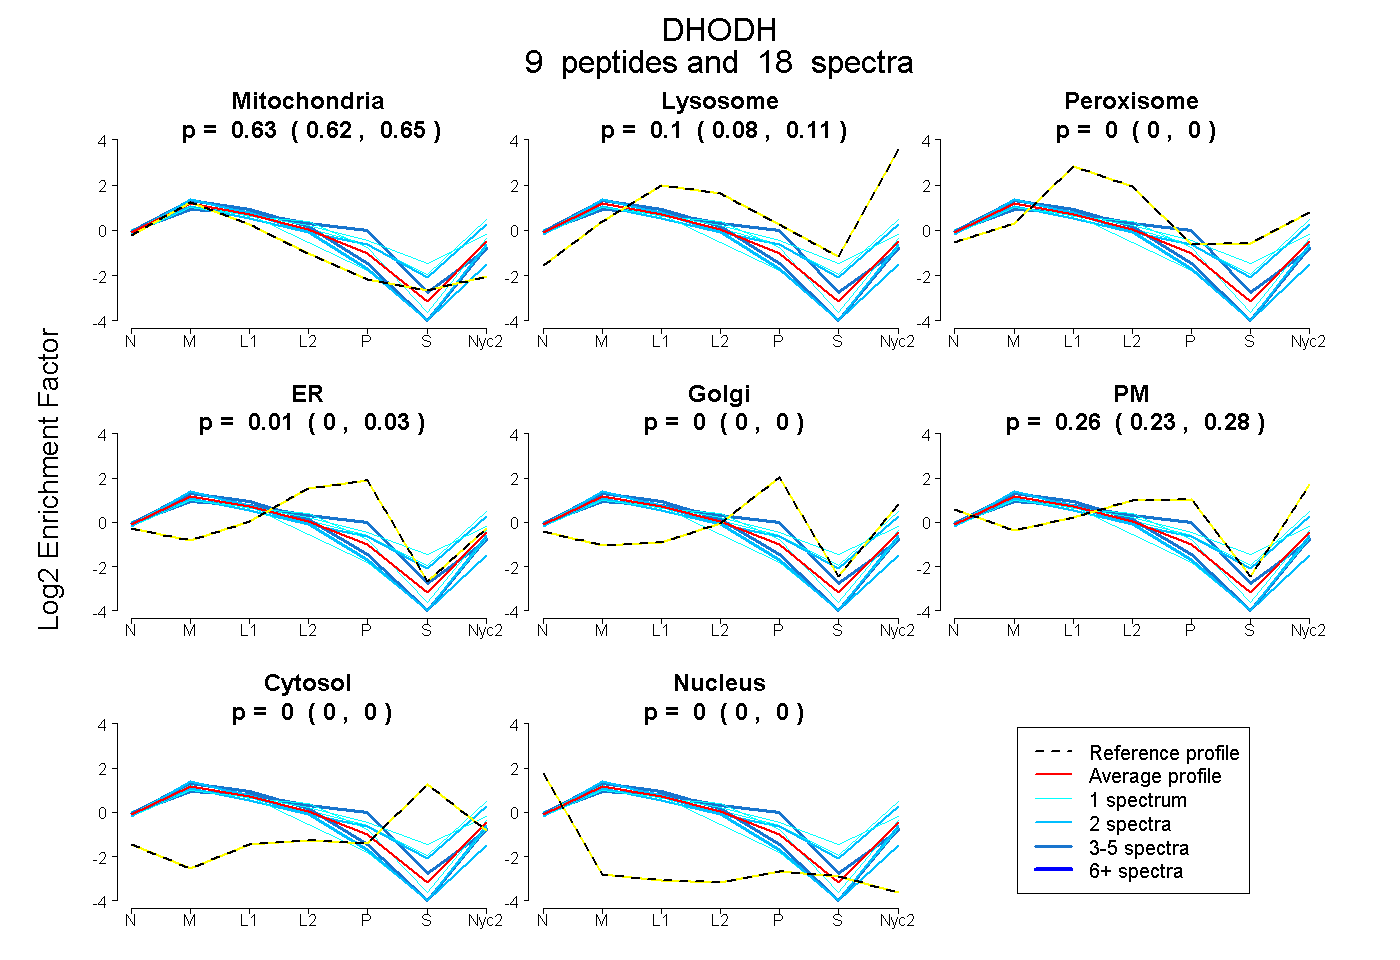
0.618 | 0.646
0.079 | 0.112
0.000 | 0.000
0.000 | 0.035
0.000 | 0.000
0.233 | 0.281
0.000 | 0.000
0.000 | 0.000
6peptides
spectra
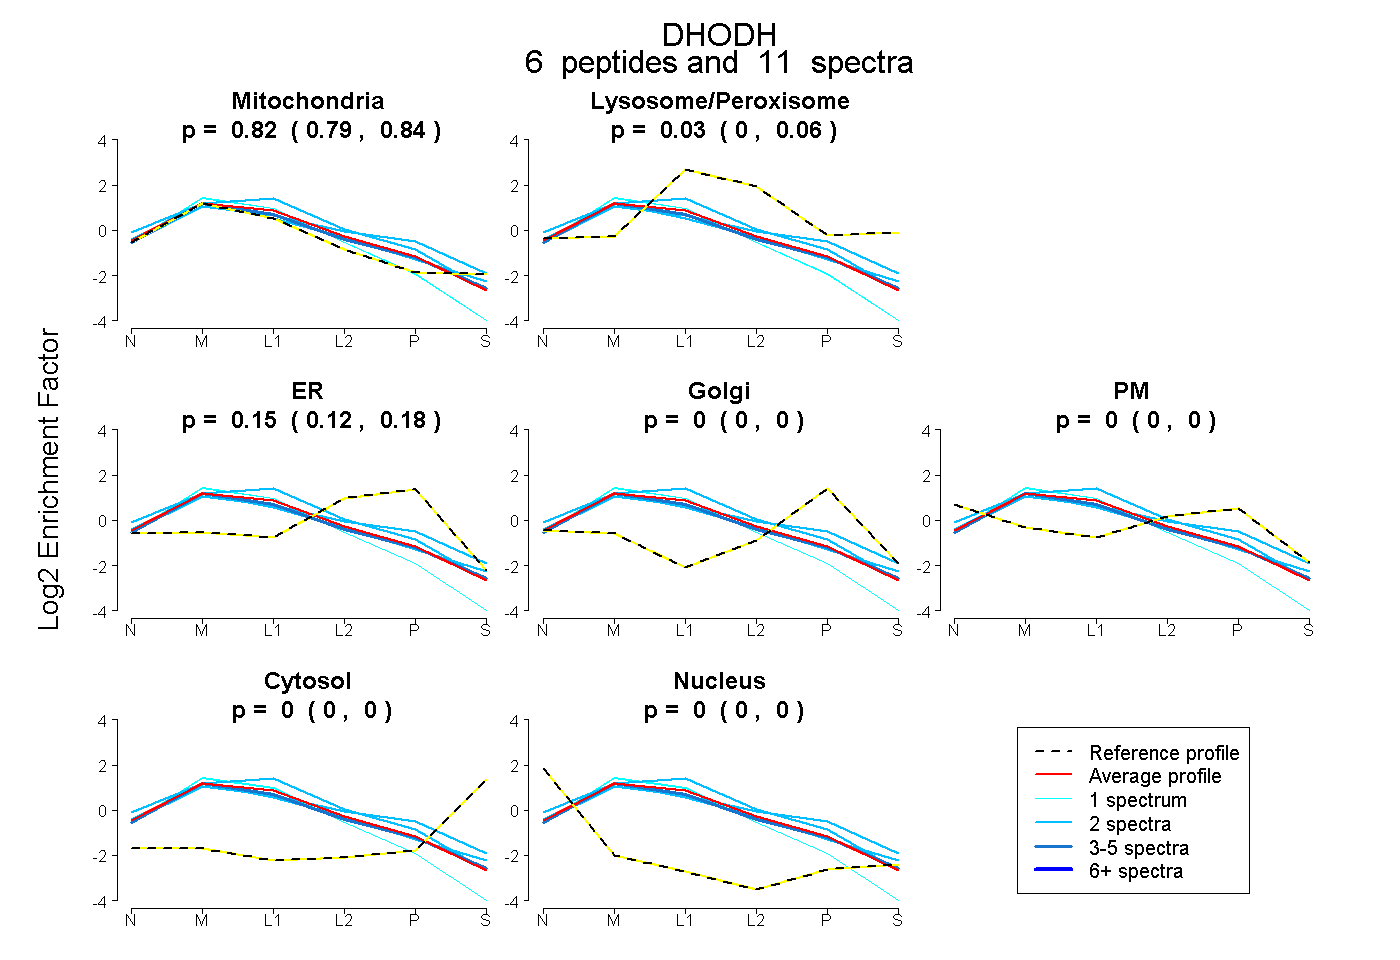
0.794 | 0.842
0.001 | 0.056
0.119 | 0.176
0.000 | 0.000
0.000 | 0.000
0.000 | 0.000
0.000 | 0.000
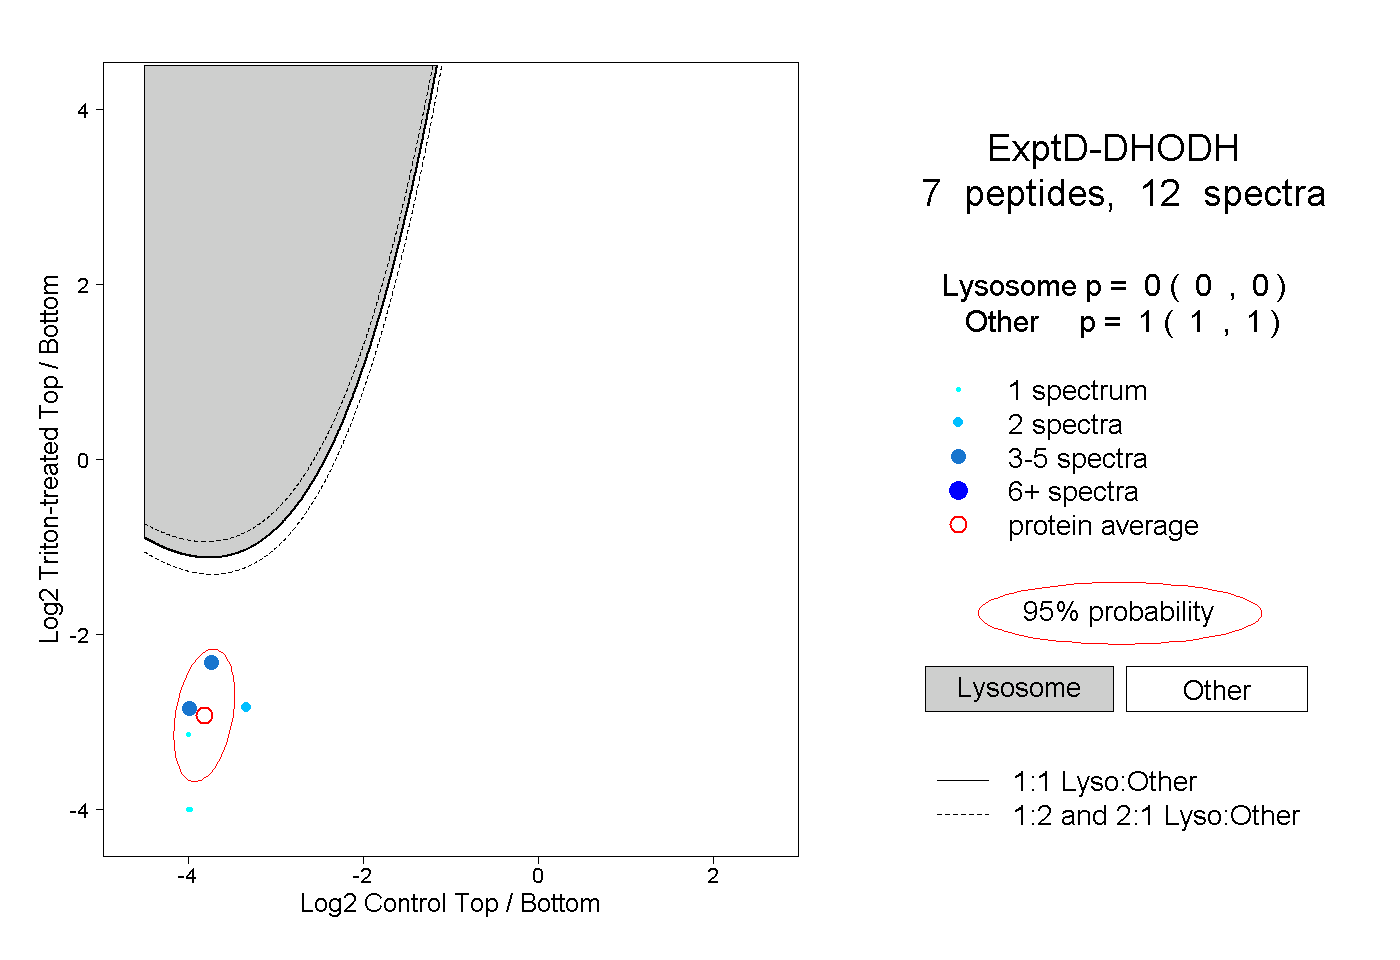
14peptides
spectra
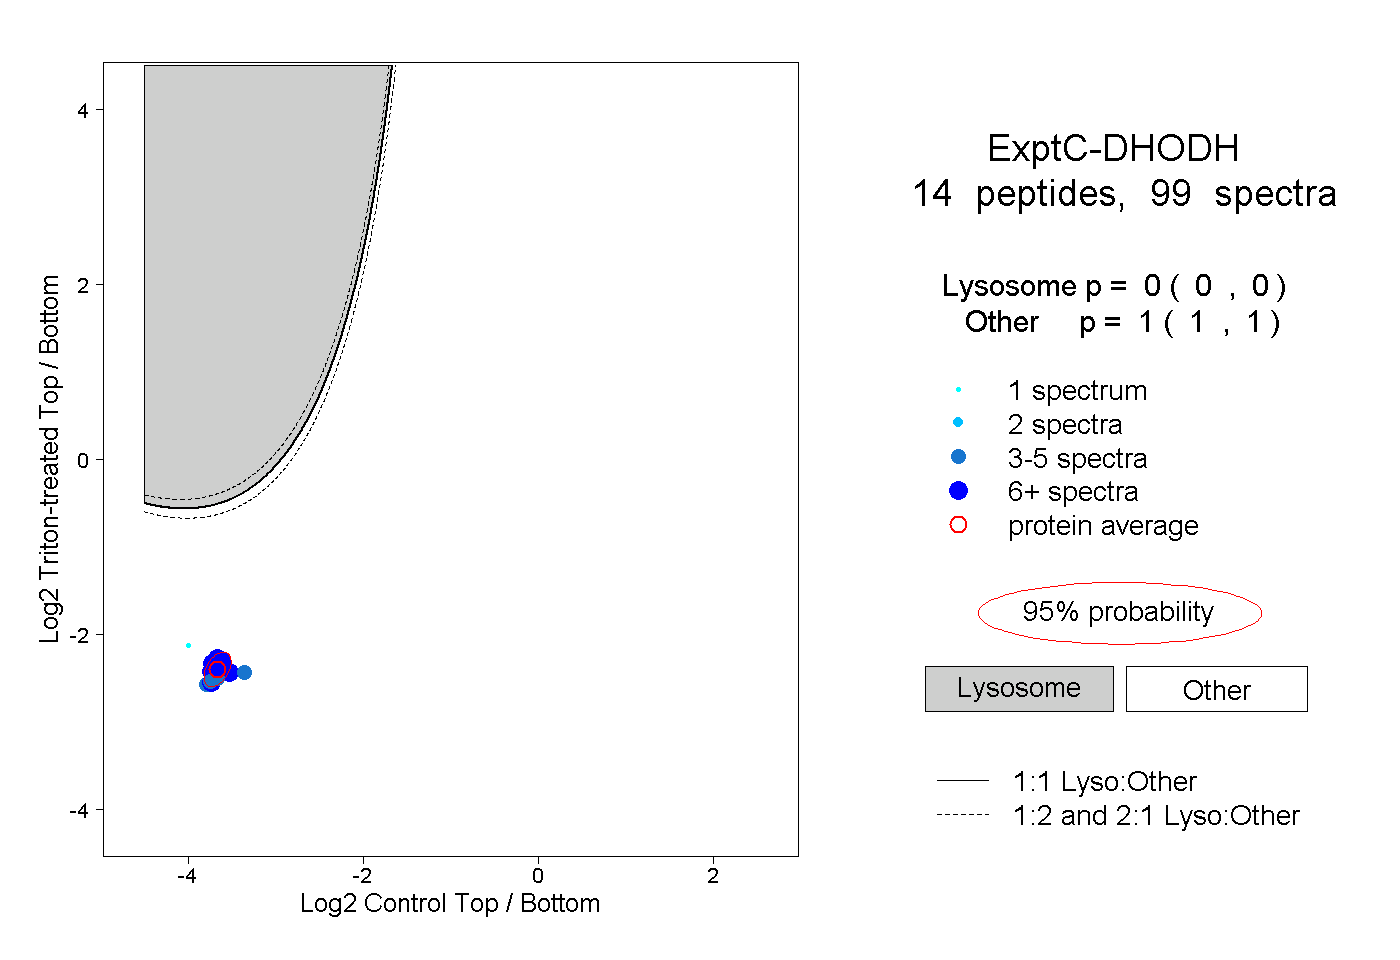
0.000 | 0.000
1.000 | 1.000