 9
9peptides
spectra
0.618 | 0.646
0.079 | 0.112
0.000 | 0.000
0.000 | 0.035
0.000 | 0.000
0.233 | 0.281
0.000 | 0.000
0.000 | 0.000
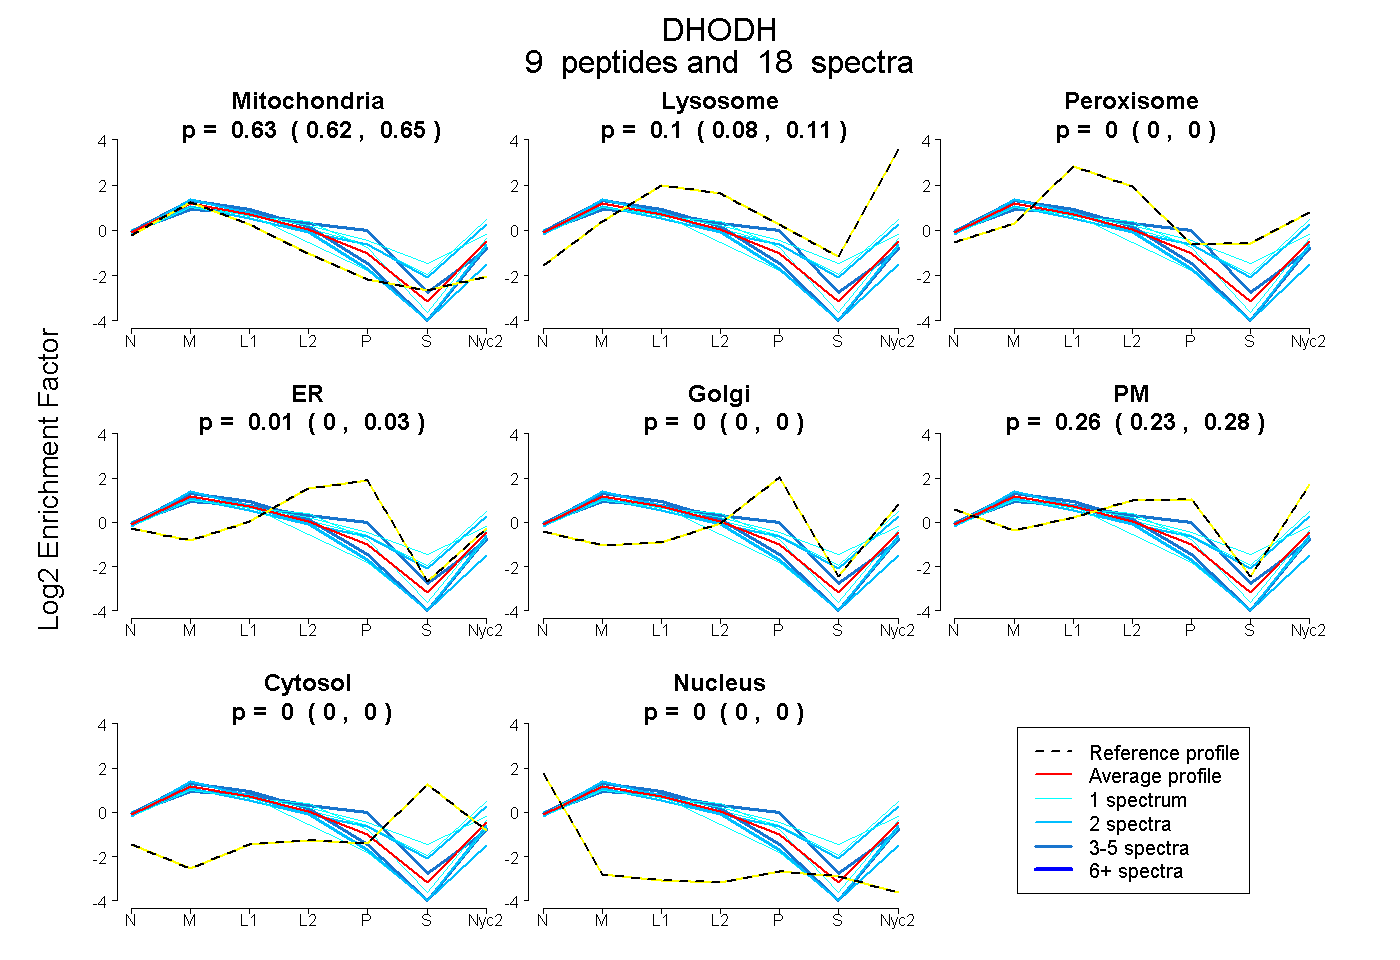
| Plot | Mito | Lyso | Perox | ER | Golgi | PM | Cytosol | Nucleus | |||||
| Expt A |
9 peptides |
18 spectra |
|
0.634 0.618 | 0.646 |
0.097 0.079 | 0.112 |
0.000 0.000 | 0.000 |
0.007 0.000 | 0.035 |
0.000 0.000 | 0.000 |
0.263 0.233 | 0.281 |
0.000 0.000 | 0.000 |
0.000 0.000 | 0.000 |
| 2 spectra, TSEDAAADYAEGVR | 0.748 | 0.080 | 0.000 | 0.000 | 0.000 | 0.172 | 0.000 | 0.000 | ||
| 1 spectrum, TLGPLADYLVVNVSSPNTAGLR | 0.792 | 0.046 | 0.000 | 0.000 | 0.000 | 0.163 | 0.000 | 0.000 | ||
| 2 spectra, LGFGFVEVGSVTPQPQEGNPRPR | 0.828 | 0.005 | 0.000 | 0.099 | 0.000 | 0.067 | 0.000 | 0.000 | ||
| 1 spectrum, SETGGLSGKPLR | 0.425 | 0.070 | 0.271 | 0.000 | 0.154 | 0.076 | 0.005 | 0.000 | ||
| 1 spectrum, EDIASVAR | 0.459 | 0.222 | 0.028 | 0.000 | 0.000 | 0.291 | 0.000 | 0.000 | ||
| 2 spectra, EMYALTQGR | 0.517 | 0.201 | 0.000 | 0.000 | 0.000 | 0.282 | 0.000 | 0.000 | ||
| 1 spectrum, NGEAVDGLYK | 0.564 | 0.047 | 0.000 | 0.065 | 0.000 | 0.325 | 0.000 | 0.000 | ||
| 4 spectra, LPEDQAVINR | 0.713 | 0.059 | 0.000 | 0.000 | 0.000 | 0.228 | 0.000 | 0.000 | ||
| 4 spectra, DLSTQTIR | 0.469 | 0.000 | 0.098 | 0.331 | 0.000 | 0.102 | 0.000 | 0.000 |
| Plot | Mito | Lyso or Perox | ER | Golgi | PM | Cytosol | Nucleus | ||||||
| Expt B |
6 peptides |
11 spectra |
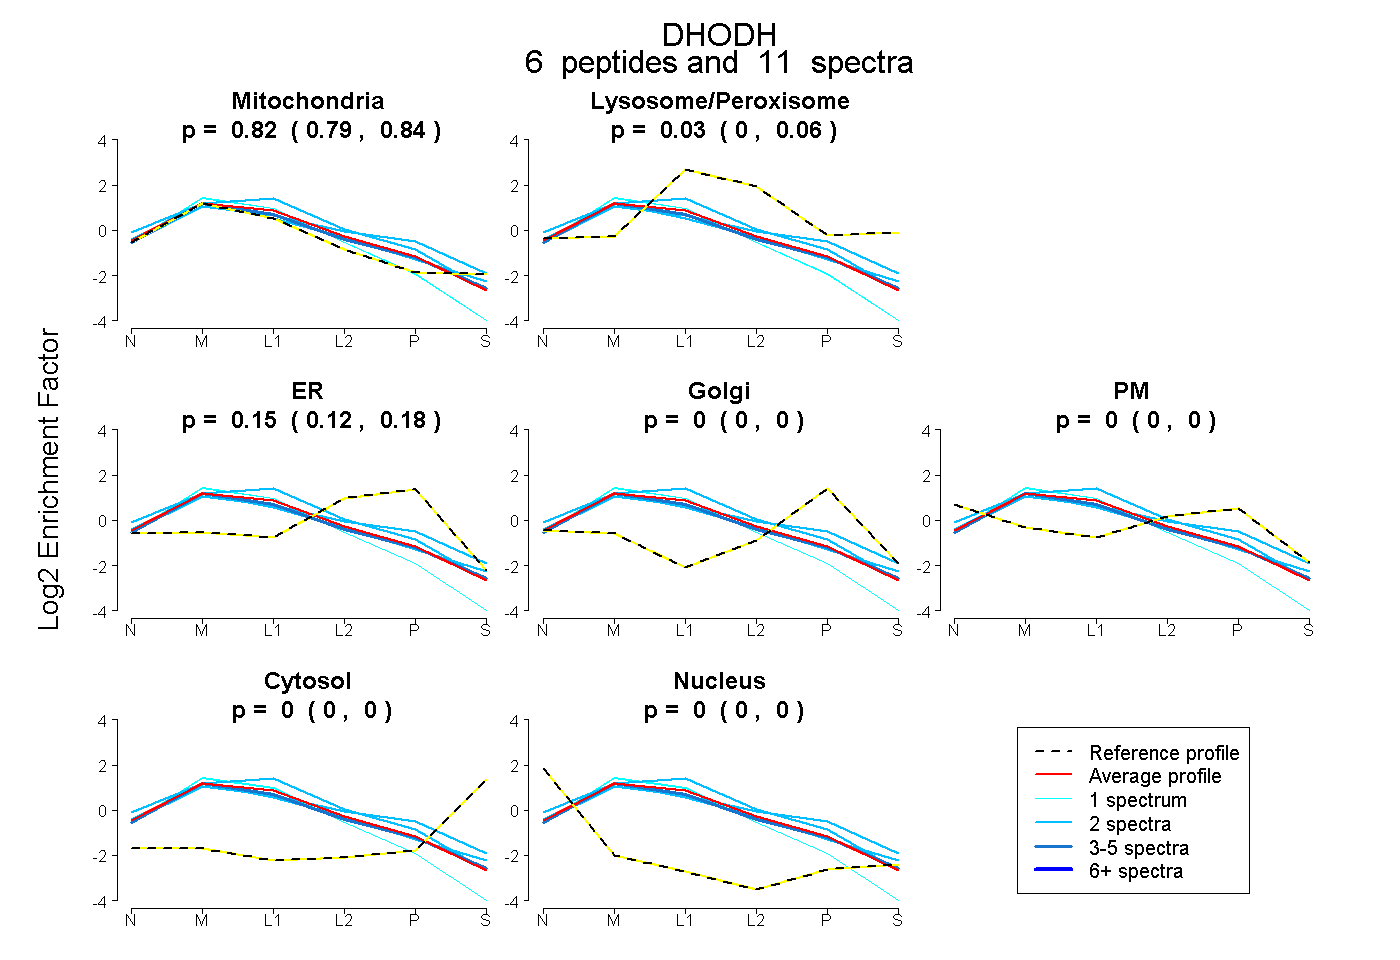 |
0.820 0.794 | 0.842 |
0.031 0.001 | 0.056 |
0.149 0.119 | 0.176 |
0.000 0.000 | 0.000 |
0.000 0.000 | 0.000 |
0.000 0.000 | 0.000 |
0.000 0.000 | 0.000 |
|||
| Plot | Lyso | Other | |||||||||||
| Expt C |
14 peptides |
99 spectra |
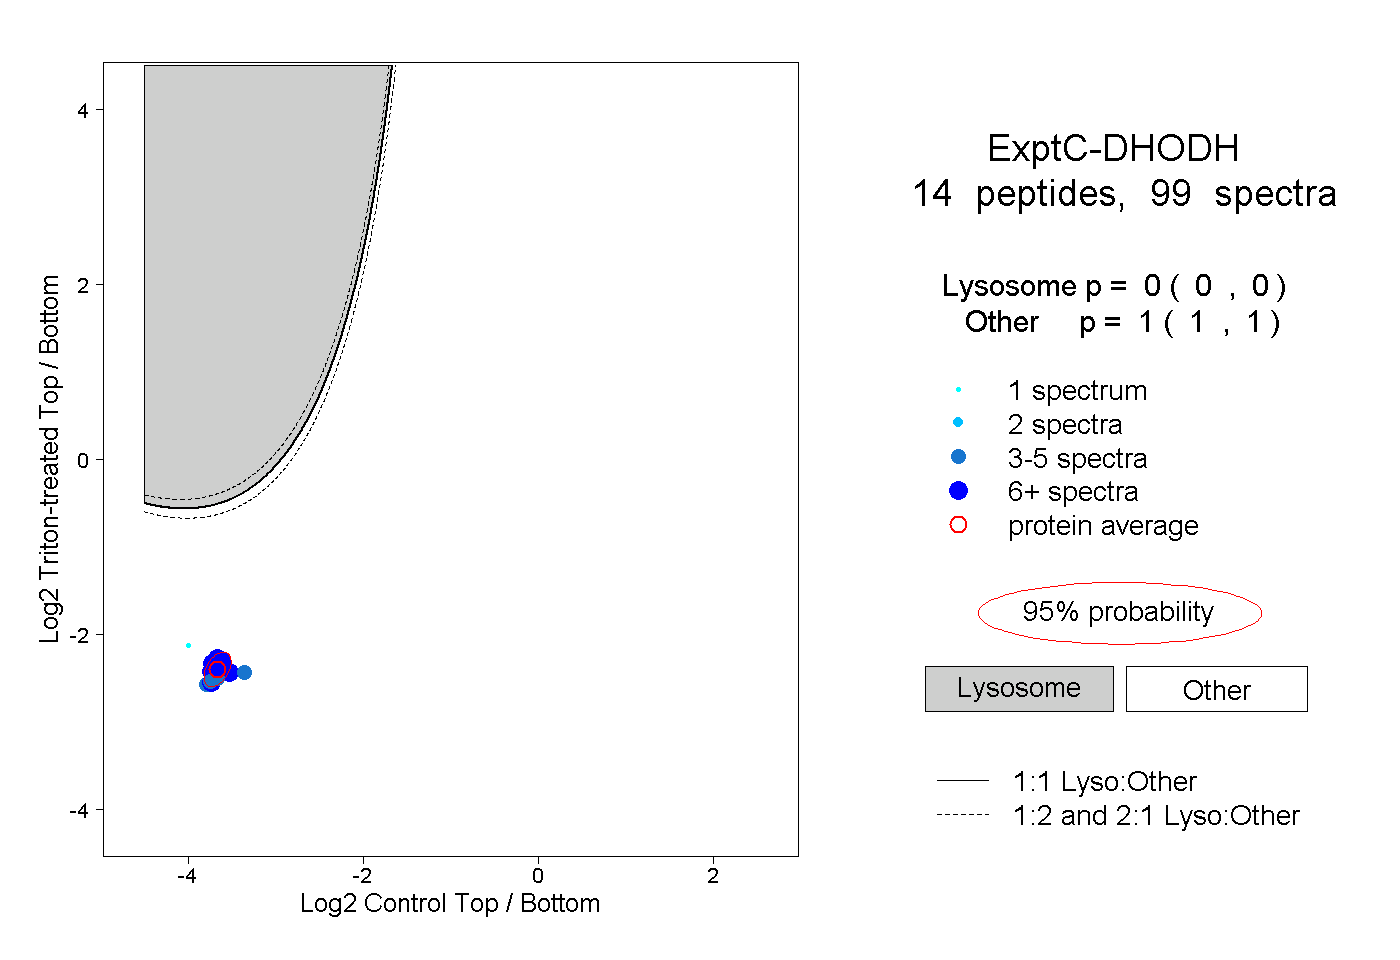 |
0.000 0.000 | 0.000 |
1.000 1.000 | 1.000 |
||||||||
| Plot | Lyso | Other | |||||||||||
| Expt D |
7 peptides |
12 spectra |
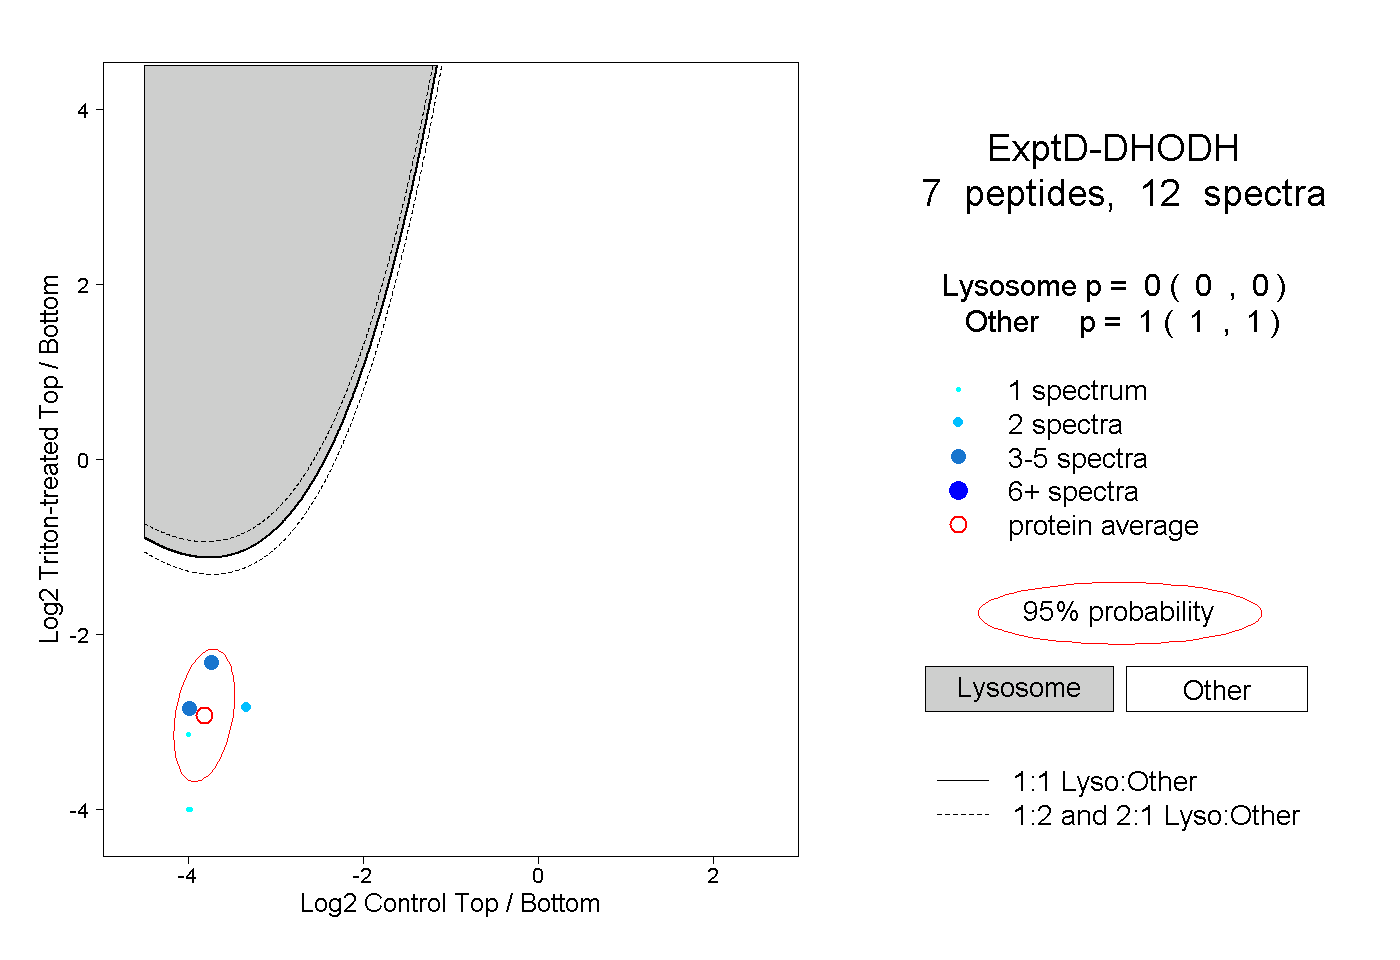 |
0.000 0.000 | 0.000 |
1.000 1.000 | 1.000 |