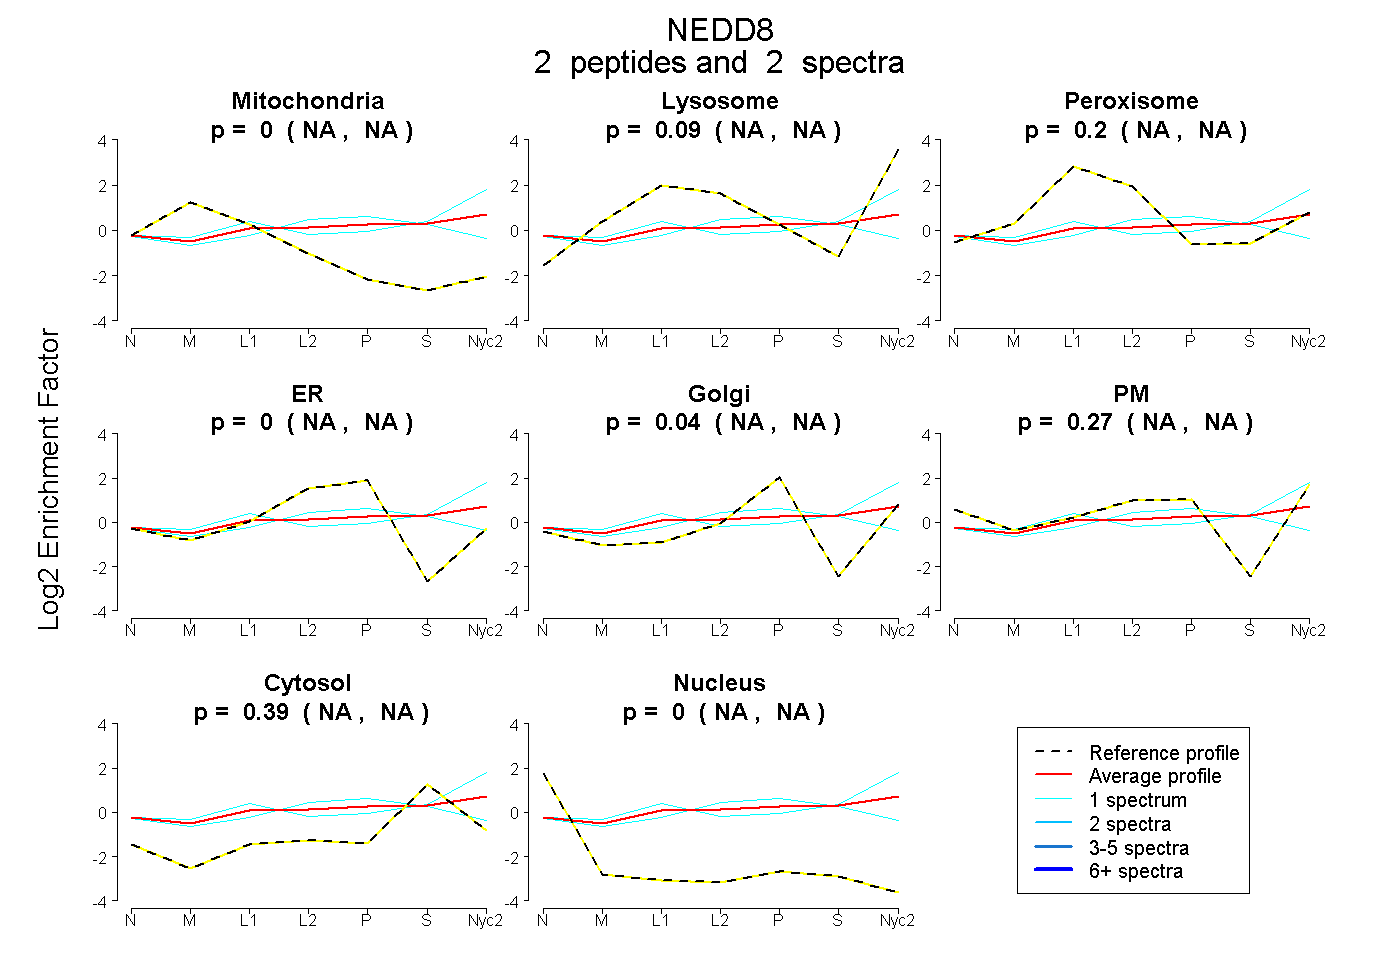
 2
2peptides
spectra
NA | NA
NA | NA
NA | NA
NA | NA
NA | NA
NA | NA
NA | NA
NA | NA
| Plot | Mito | Lyso | Perox | ER | Golgi | PM | Cytosol | Nucleus | |||||
| Expt A |
2 peptides |
2 spectra |
|
0.000 NA | NA |
0.089 NA | NA |
0.205 NA | NA |
0.000 NA | NA |
0.042 NA | NA |
0.271 NA | NA |
0.393 NA | NA |
0.000 NA | NA |
| 1 spectrum, EGIPPQQQR | 0.000 | 0.000 | 0.228 | 0.303 | 0.068 | 0.000 | 0.401 | 0.000 | ||
| 1 spectrum, QMNDEK | 0.000 | 0.399 | 0.024 | 0.000 | 0.000 | 0.189 | 0.388 | 0.000 |
| Plot | Lyso | Other | |||||||||||
| Expt C |
3 peptides |
17 spectra |
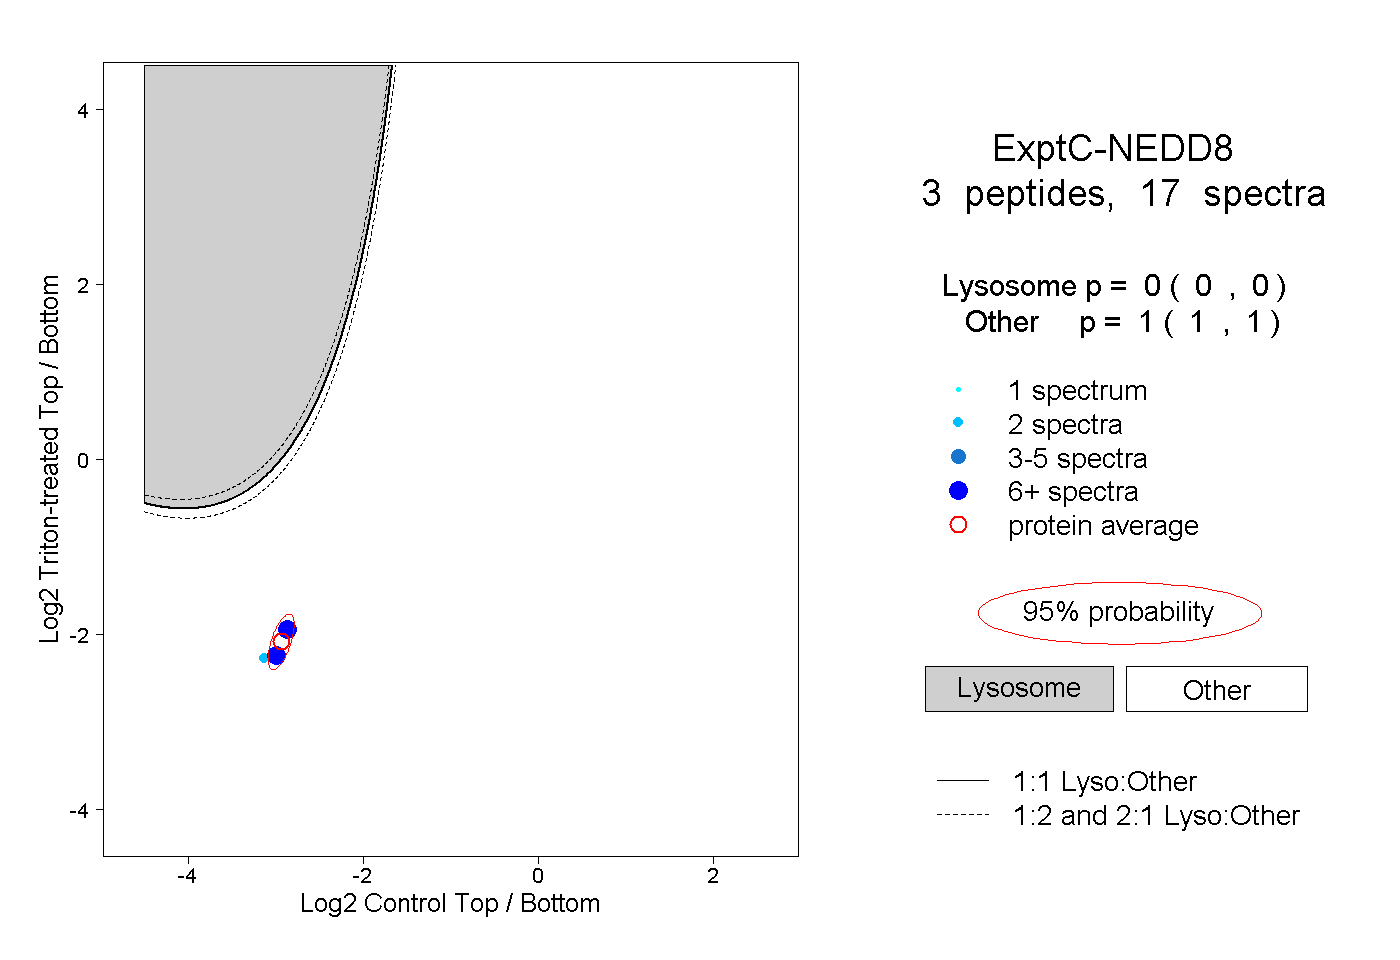 |
0.000 0.000 | 0.000 |
1.000 1.000 | 1.000 |