 4
4peptides
spectra
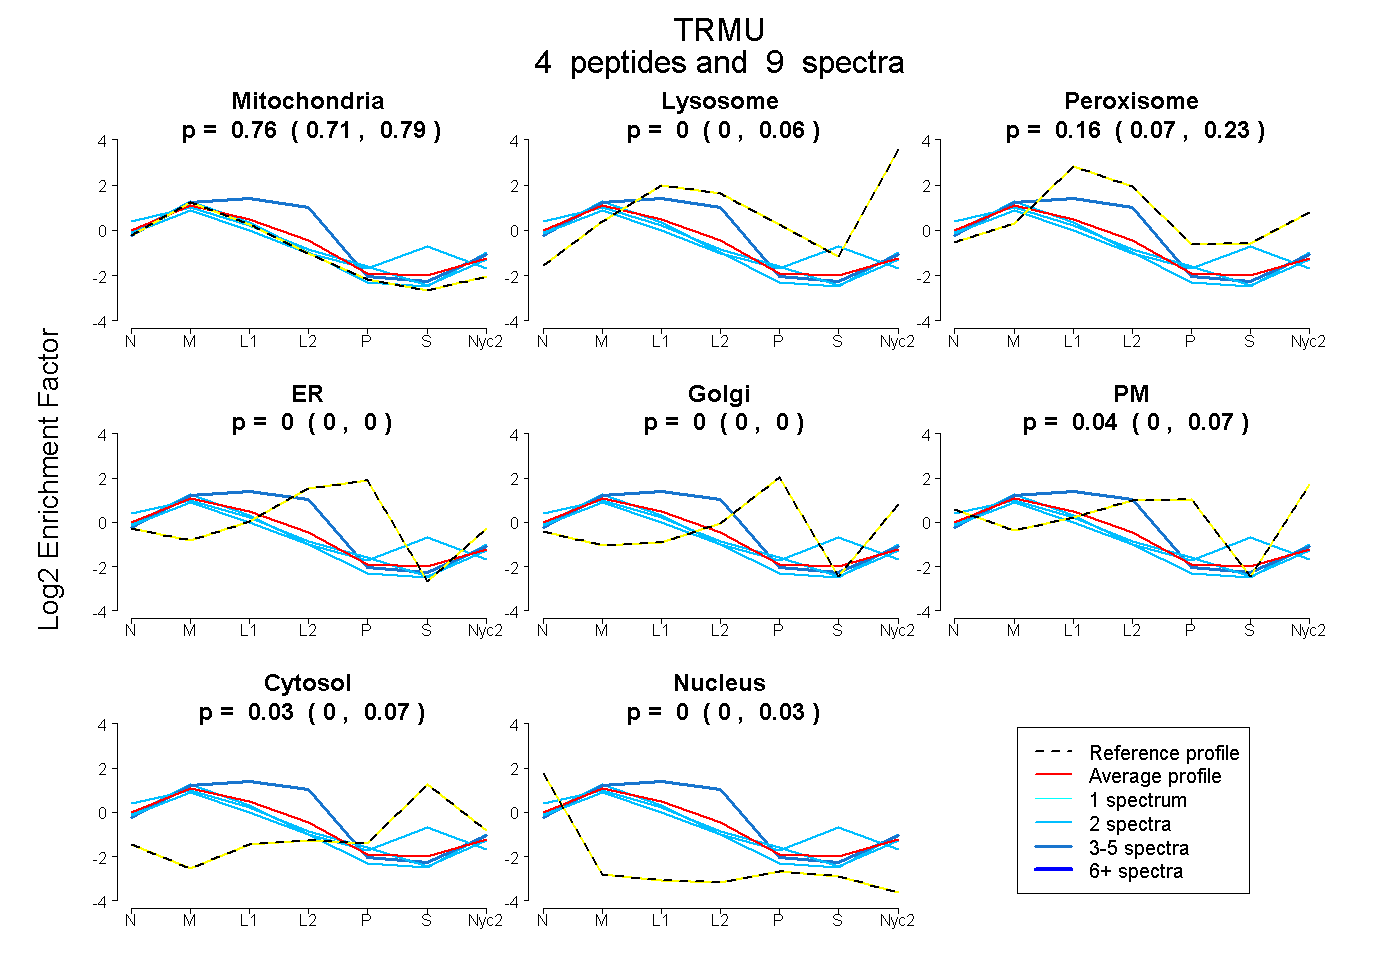
0.709 | 0.791
0.000 | 0.057
0.074 | 0.233
0.000 | 0.000
0.000 | 0.000
0.000 | 0.072
0.000 | 0.066
0.000 | 0.030
2peptides
spectra
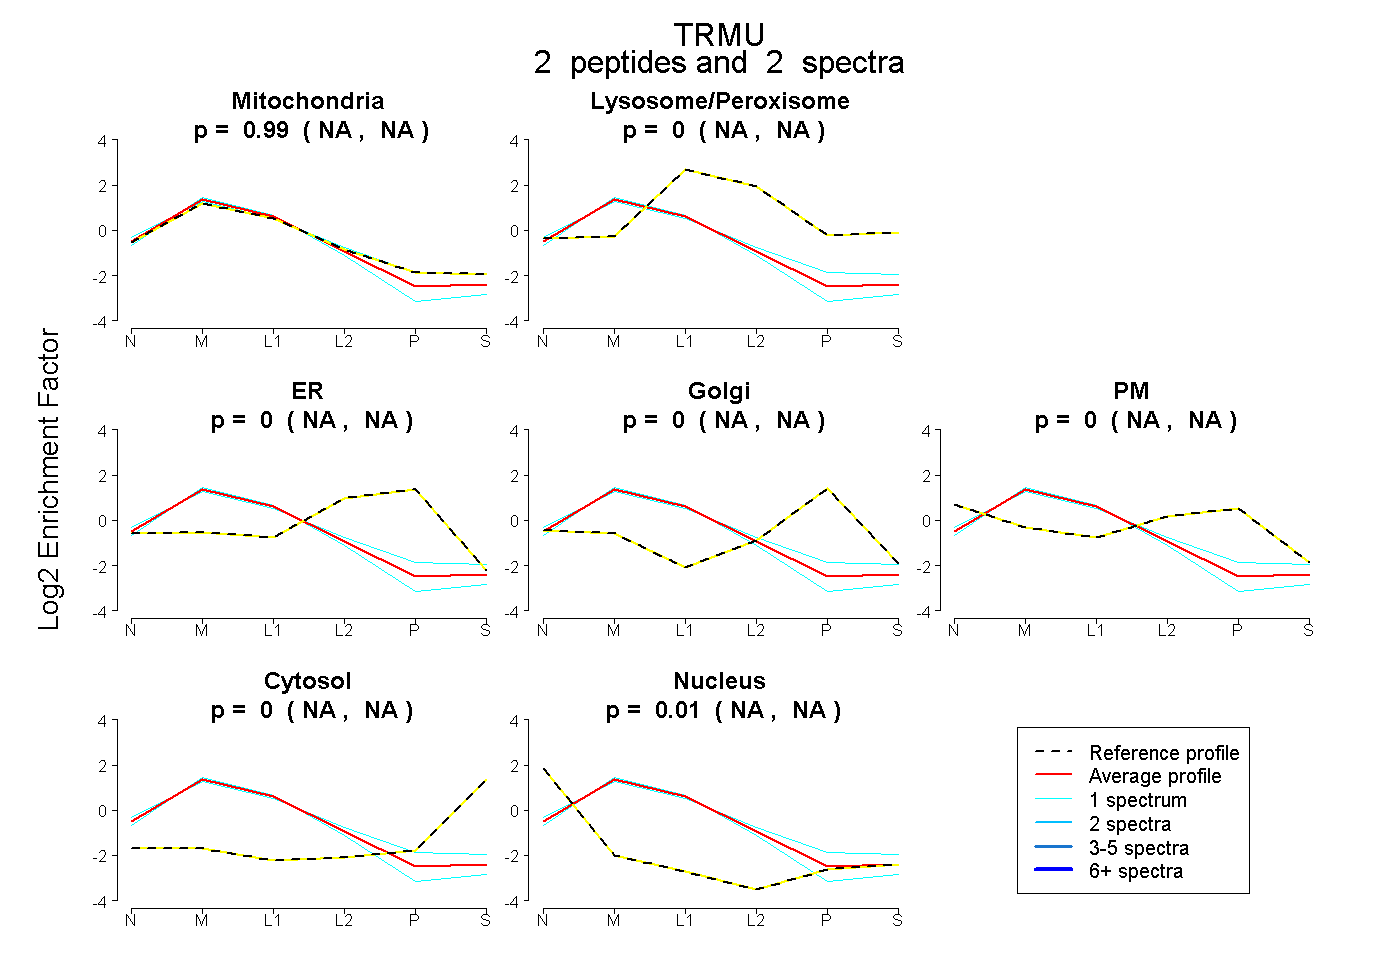
NA | NA
NA | NA
NA | NA
NA | NA
NA | NA
NA | NA
NA | NA
15peptides
spectra
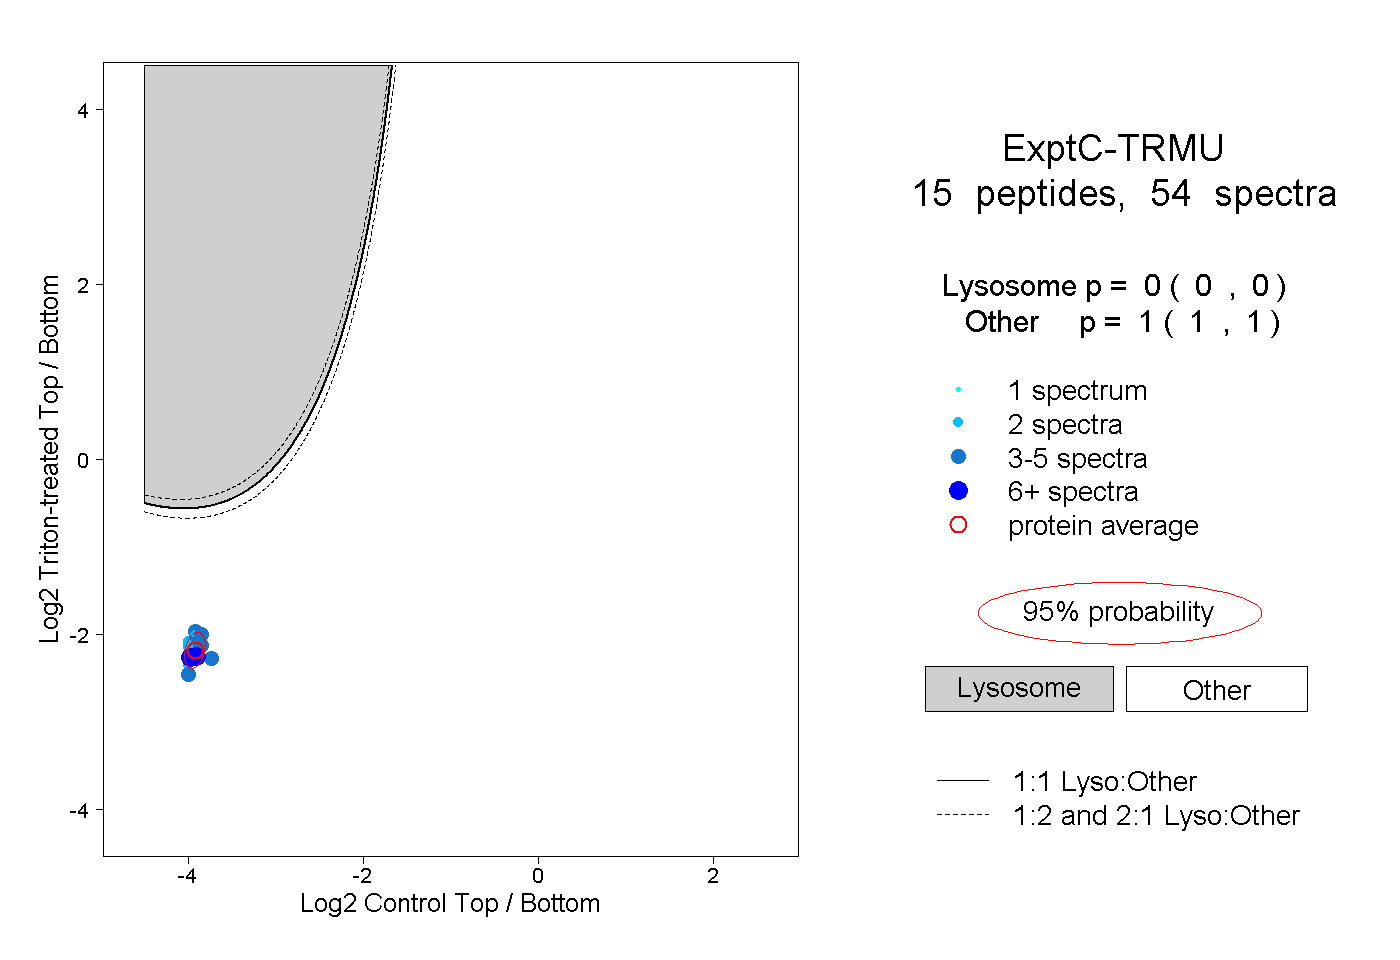
0.000 | 0.000
1.000 | 1.000
3peptides
spectra
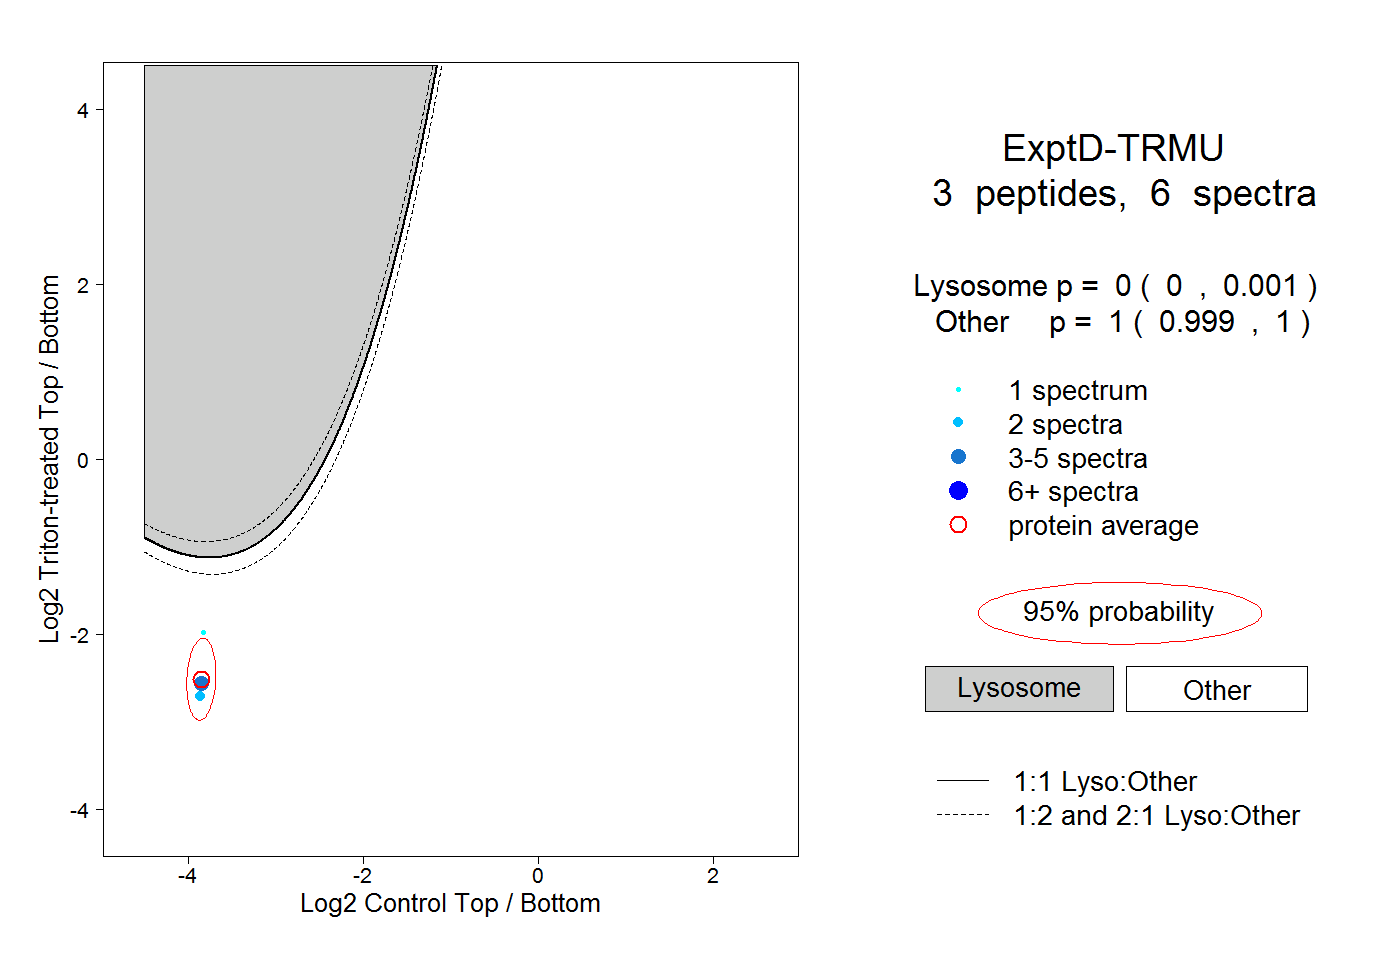
0.000 | 0.001
0.999 | 1.000