 4
4peptides
spectra
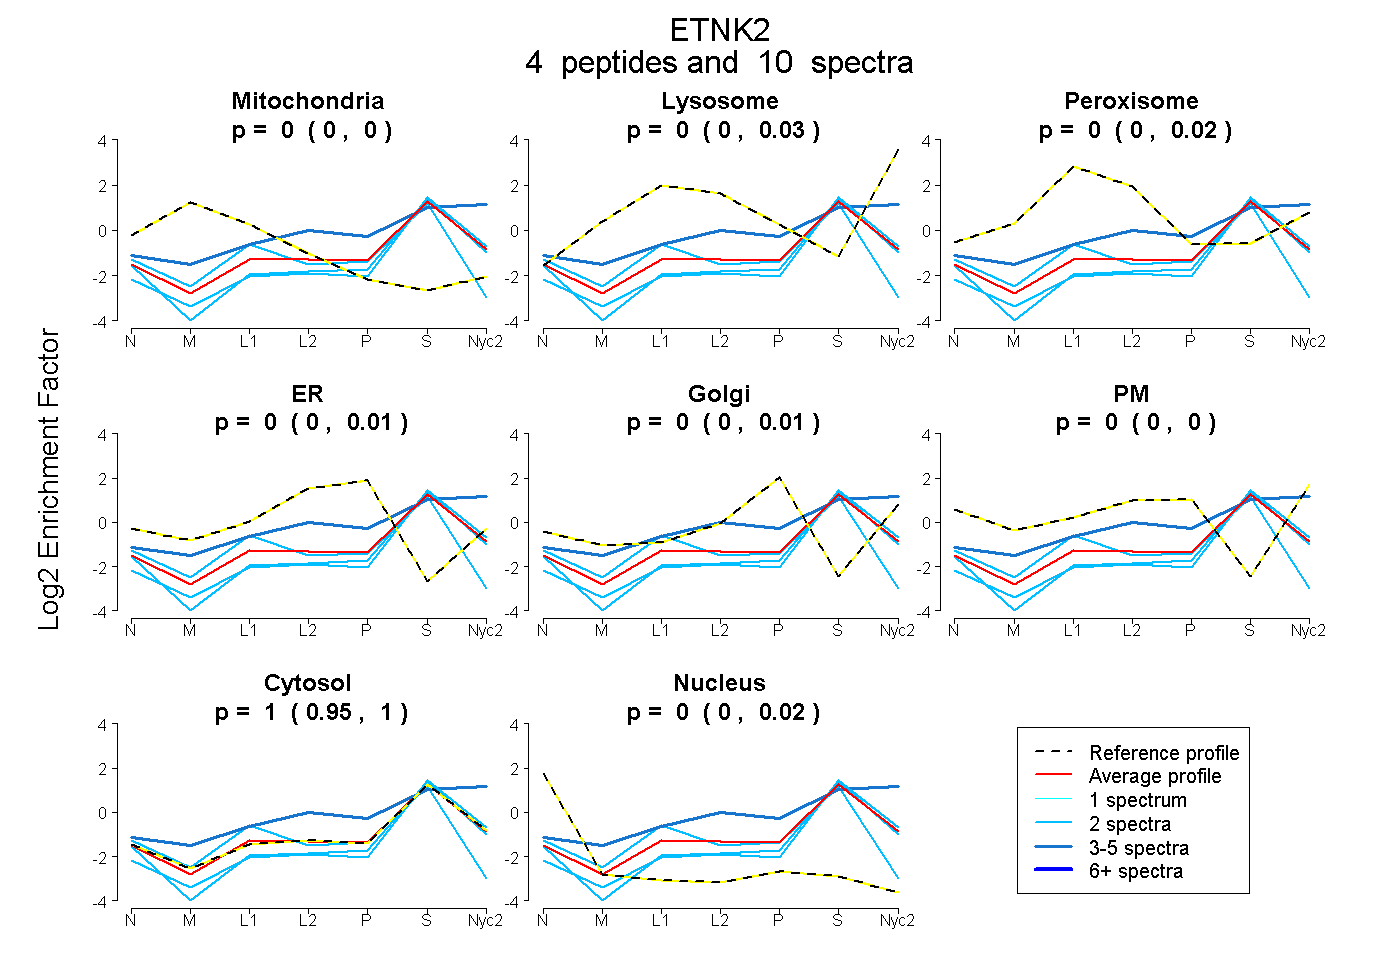
0.000 | 0.002
0.000 | 0.035
0.000 | 0.019
0.000 | 0.010
0.000 | 0.006
0.000 | 0.000
0.952 | 1.000
0.000 | 0.025
| Plot | Mito | Lyso | Perox | ER | Golgi | PM | Cytosol | Nucleus | |||||
| Expt A |
4 peptides |
10 spectra |
|
0.000 0.000 | 0.002 |
0.000 0.000 | 0.035 |
0.000 0.000 | 0.019 |
0.000 0.000 | 0.010 |
0.000 0.000 | 0.006 |
0.000 0.000 | 0.000 |
1.000 0.952 | 1.000 |
0.000 0.000 | 0.025 |
| 2 spectra, VYGEWTELLVDR | 0.000 | 0.000 | 0.000 | 0.000 | 0.000 | 0.000 | 1.000 | 0.000 | ||
| 4 spectra, NFQLLR | 0.000 | 0.349 | 0.000 | 0.000 | 0.025 | 0.000 | 0.626 | 0.000 | ||
| 2 spectra, AVASASCWEPPGPPR | 0.069 | 0.000 | 0.000 | 0.000 | 0.000 | 0.000 | 0.830 | 0.101 | ||
| 2 spectra, EPQLFR | 0.000 | 0.000 | 0.000 | 0.000 | 0.000 | 0.000 | 0.950 | 0.050 |
| Plot | Lyso | Other | |||||||||||
| Expt C |
3 peptides |
9 spectra |
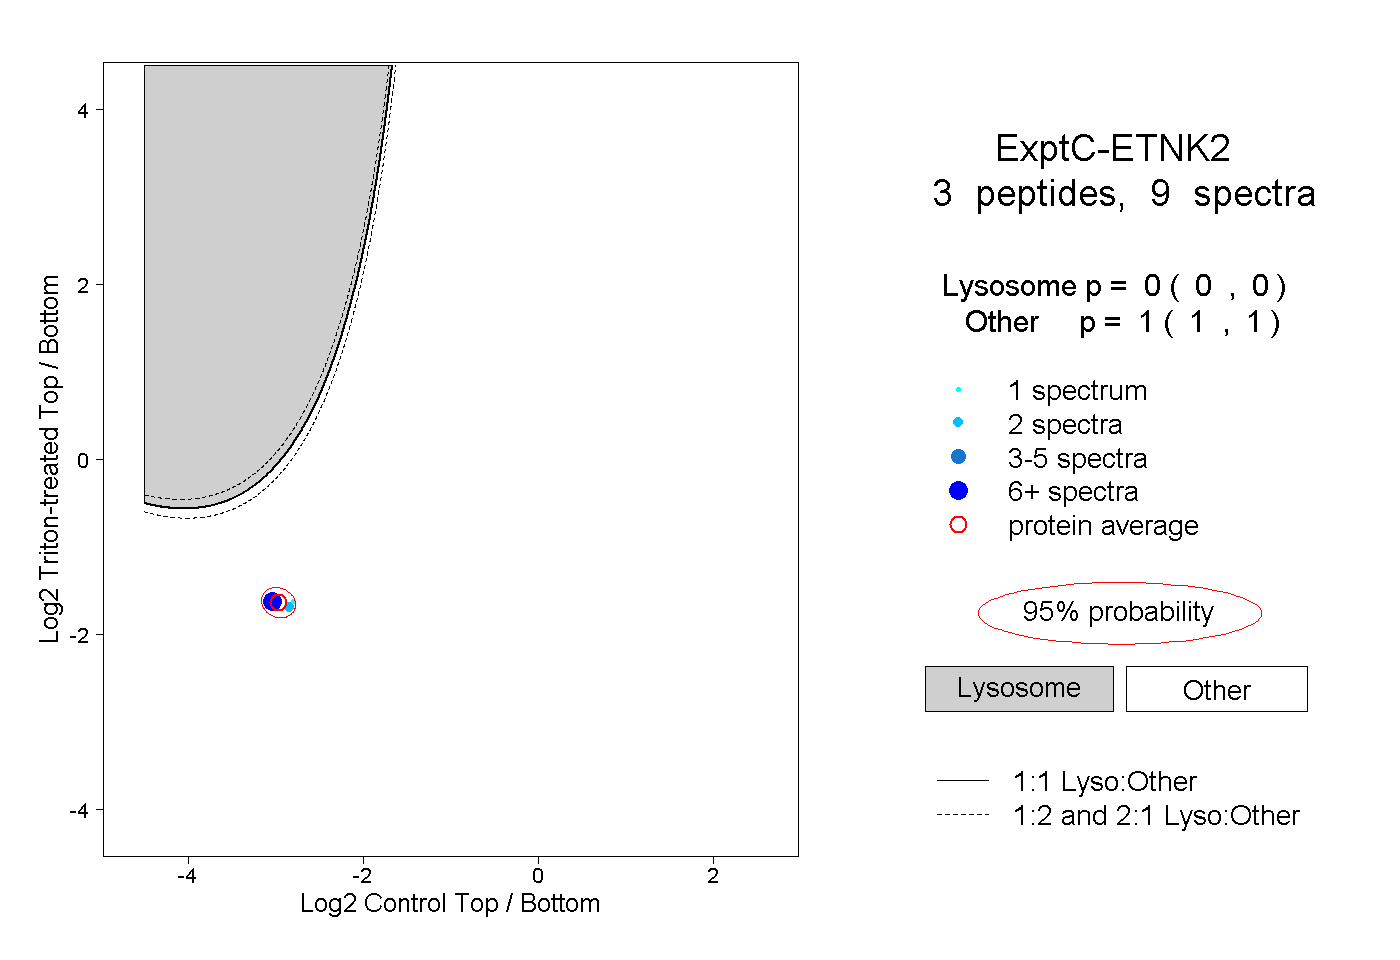 |
0.000 0.000 | 0.000 |
1.000 1.000 | 1.000 |