 4
4peptides
spectra
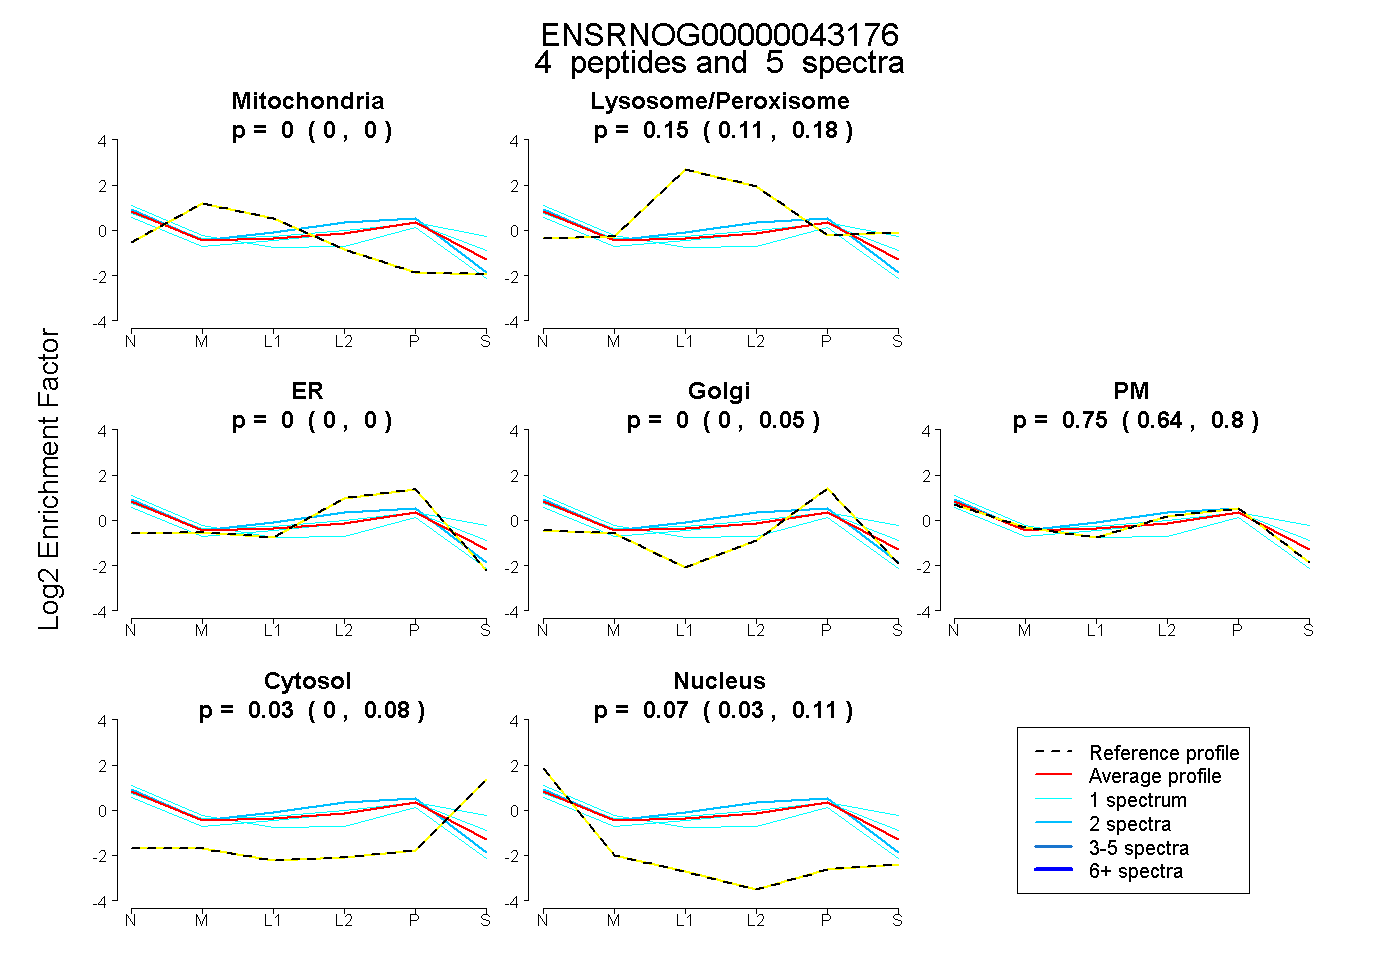
0.000 | 0.000
0.109 | 0.184
0.000 | 0.000
0.000 | 0.055
0.636 | 0.796
0.000 | 0.080
0.031 | 0.107
| Plot | Mito | Lyso or Perox | ER | Golgi | PM | Cytosol | Nucleus | ||||||
| Expt B |
4 peptides |
5 spectra |
|
0.000 0.000 | 0.000 |
0.149 0.109 | 0.184 |
0.000 0.000 | 0.000 |
0.000 0.000 | 0.055 |
0.748 0.636 | 0.796 |
0.030 0.000 | 0.080 |
0.074 0.031 | 0.107 |
| 2 spectra, TYLDVEPITGFTLQFAK | 0.000 | 0.128 | 0.000 | 0.000 | 0.870 | 0.000 | 0.002 | |||
| 1 spectrum, FFSPDICR | 0.061 | 0.000 | 0.000 | 0.000 | 0.794 | 0.000 | 0.144 | |||
| 1 spectrum, VAIIDTYK | 0.000 | 0.179 | 0.000 | 0.000 | 0.605 | 0.215 | 0.000 | |||
| 1 spectrum, EVVLEEGTIAFK | 0.000 | 0.181 | 0.000 | 0.000 | 0.703 | 0.084 | 0.031 |
| Plot | Lyso | Other | |||||||||||
| Expt D |
2 peptides |
5 spectra |
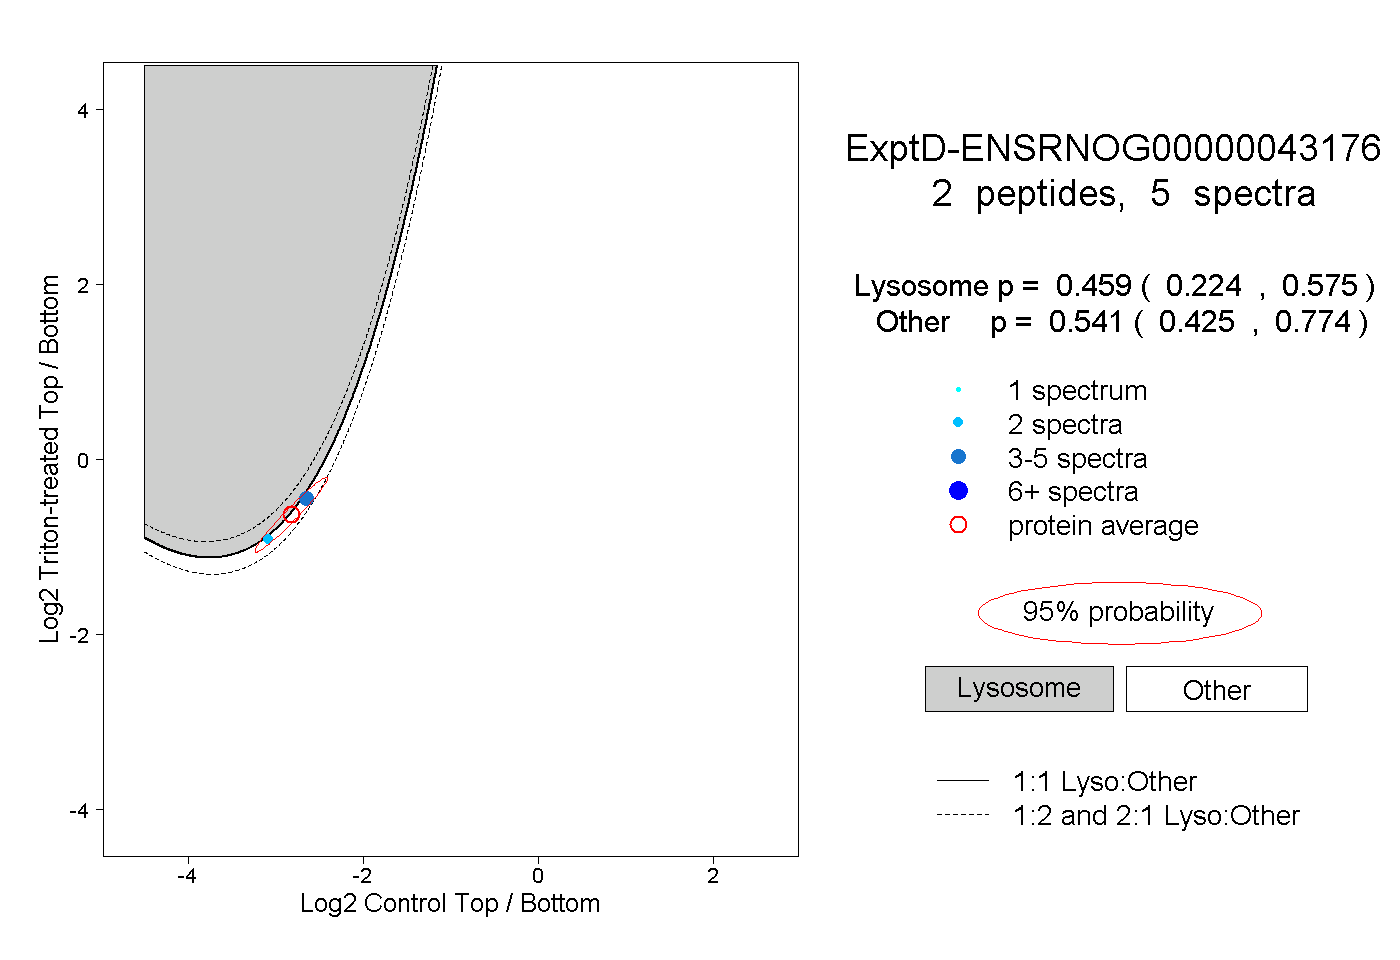 |
0.459 0.224 | 0.575 |
0.541 0.425 | 0.774 |