 6
6peptides
spectra
0.000 | 0.000
0.250 | 0.302
0.061 | 0.113
0.000 | 0.000
0.000 | 0.000
0.491 | 0.524
0.112 | 0.134
0.000 | 0.000
7peptides
spectra
0.000 | 0.000
1.000 | 1.000
| Plot | Mito | Lyso | Perox | ER | Golgi | PM | Cytosol | Nucleus | |||||
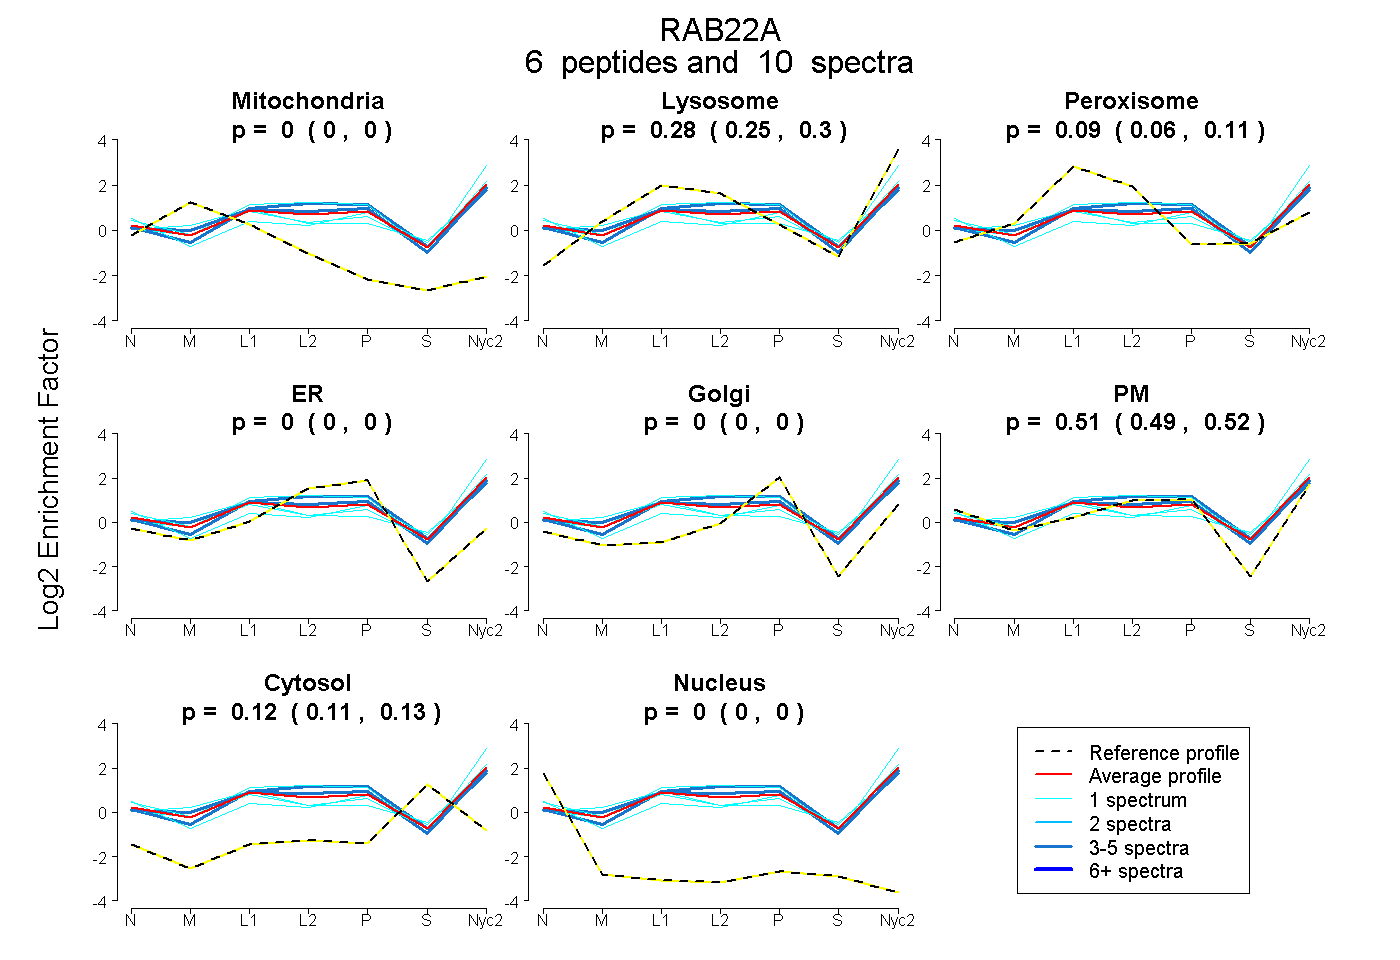
| Expt A |
6 peptides |
10 spectra |
|
0.000 0.000 | 0.000 |
0.279 0.250 | 0.302 |
0.090 0.061 | 0.113 |
0.000 0.000 | 0.000 |
0.000 0.000 | 0.000 |
0.508 0.491 | 0.524 |
0.124 0.112 | 0.134 |
0.000 0.000 | 0.000 |
||
| Plot | Lyso | Other | |||||||||||
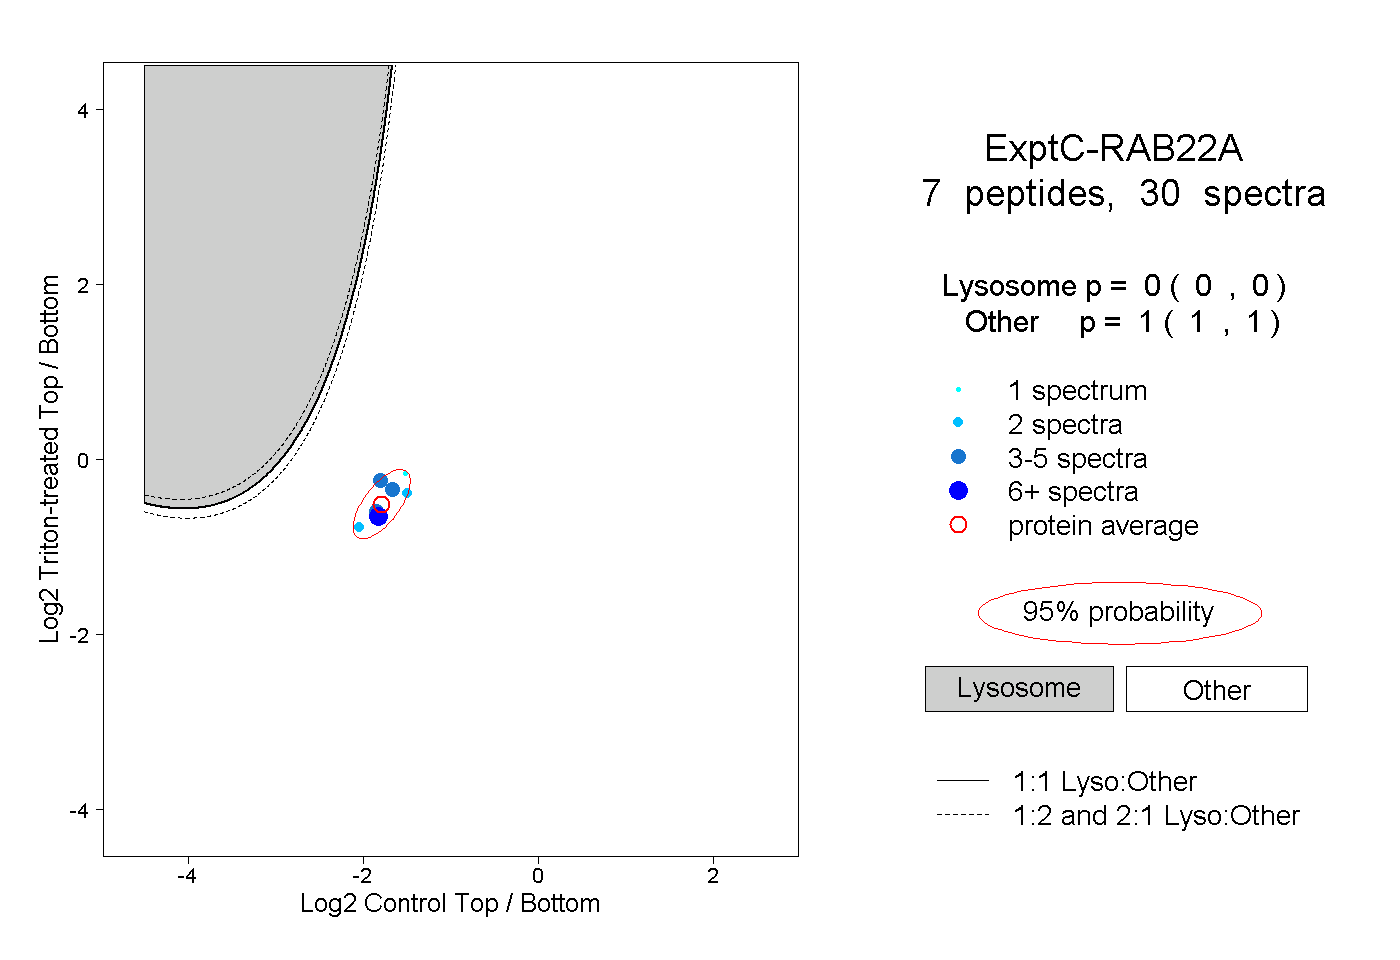
| Expt C |
7 peptides |
30 spectra |
|
0.000 0.000 | 0.000 |
1.000 1.000 | 1.000 |
| 1 spectrum, NAININELFIEISR | 0.000 | 1.000 | ||||||||
| 4 spectra, VCLLGDTGVGK | 0.000 | 1.000 | ||||||||
| 2 spectra, SSIVWR | 0.000 | 1.000 | ||||||||
| 2 spectra, LPSTDASPASGGK | 0.000 | 1.000 | ||||||||
| 5 spectra, FLIWDTAGQER | 0.000 | 1.000 | ||||||||
| 12 spectra, TVQYQNELHK | 0.000 | 1.000 | ||||||||
| 4 spectra, CDLTDVR | 0.000 | 1.000 |
| Plot | Lyso | Other | |||||||||||
| Expt D |
1 peptide |
1 spectrum |
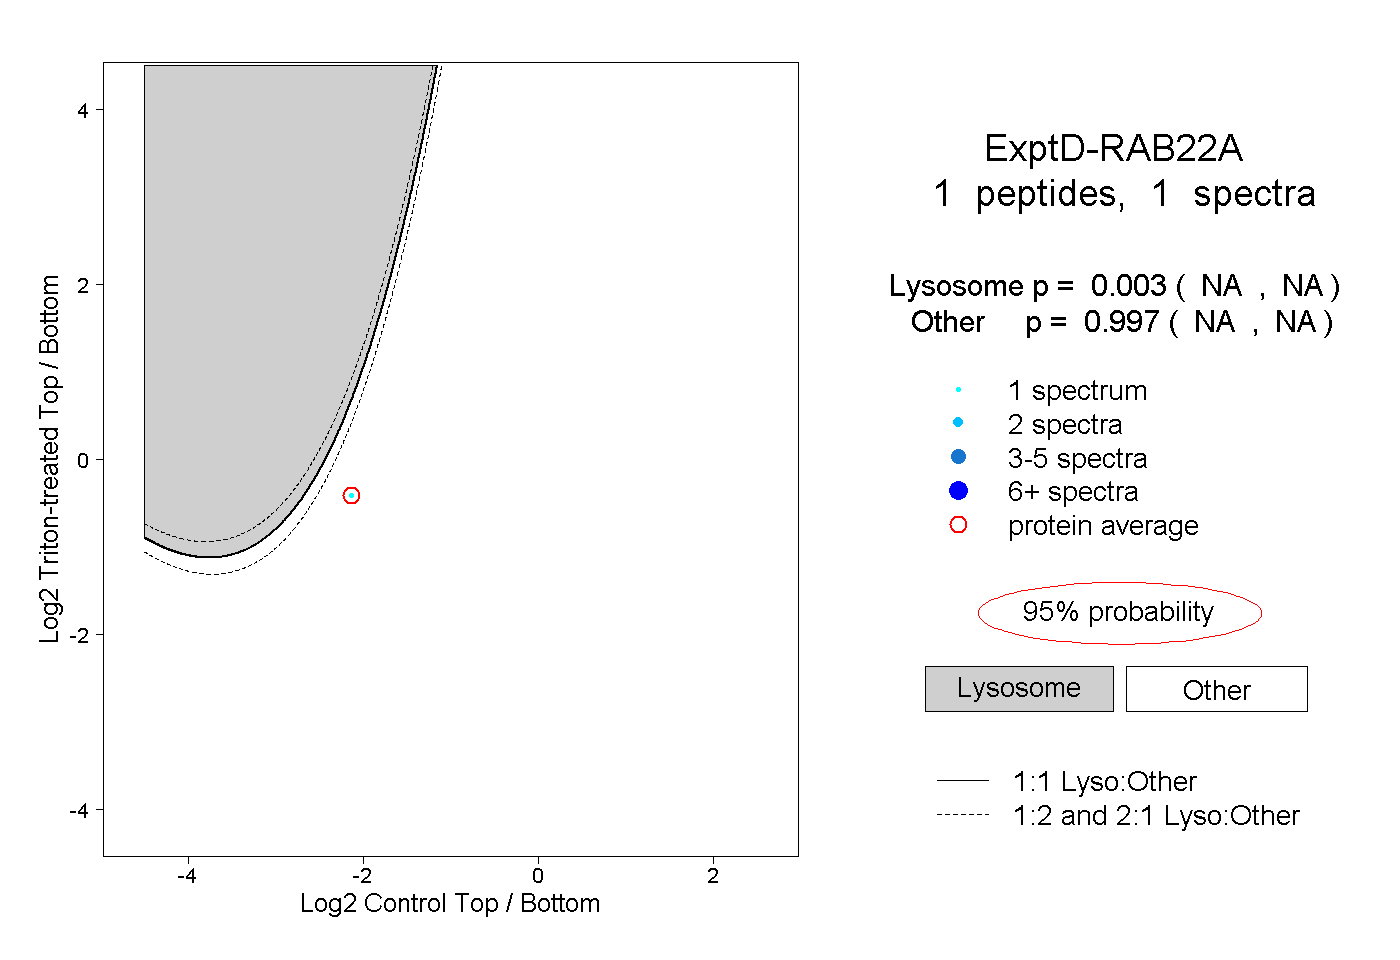 |
0.003 NA | NA |
0.997 NA | NA |