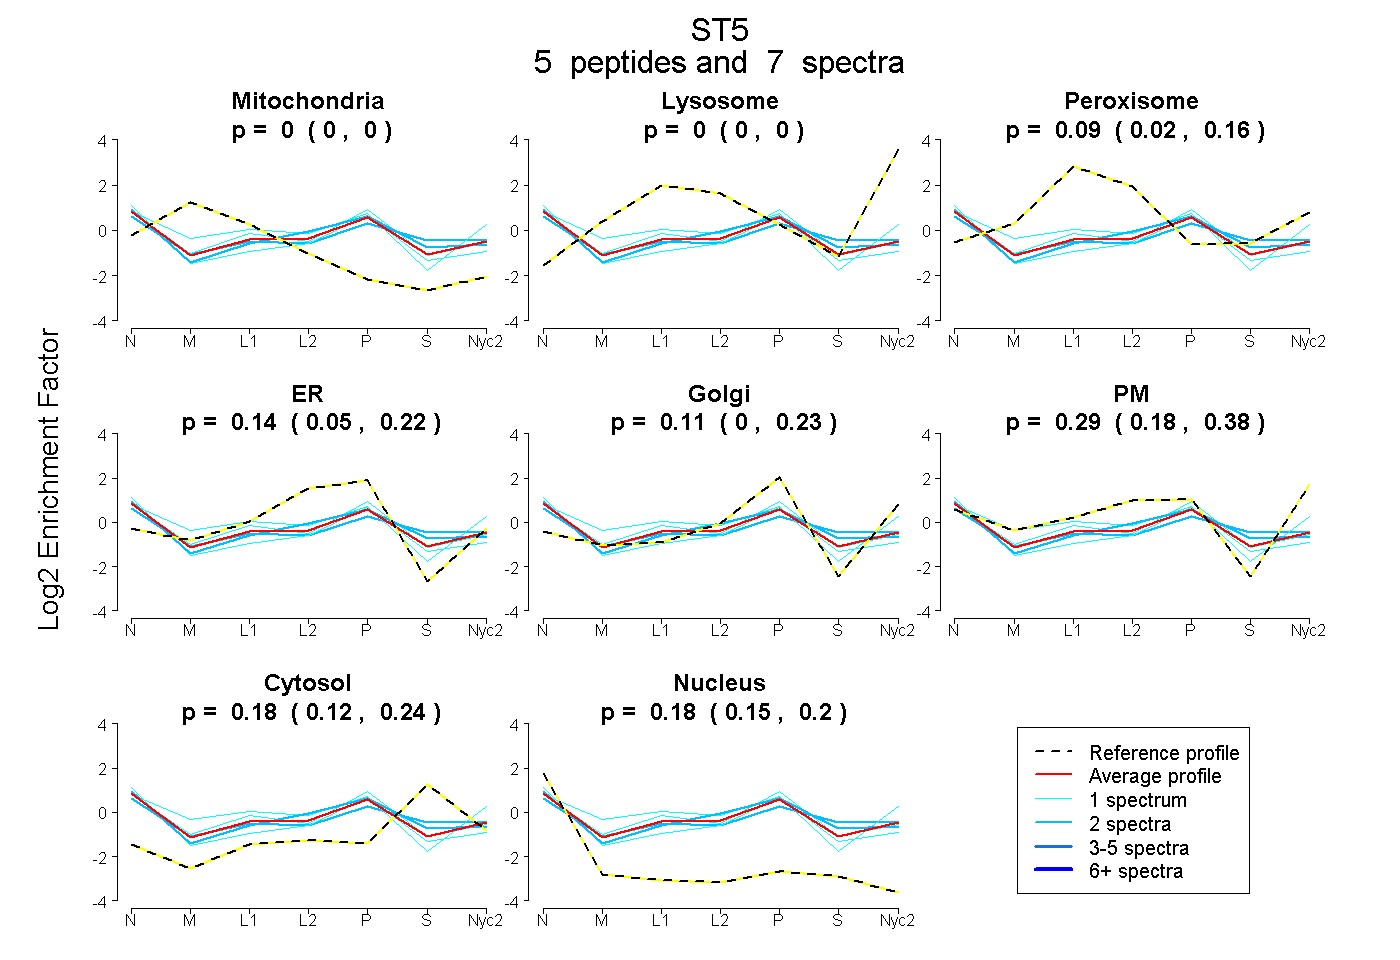
 5
5peptides
spectra
0.000 | 0.000
0.000 | 0.000
0.015 | 0.158
0.050 | 0.216
0.000 | 0.231
0.179 | 0.385
0.120 | 0.236
0.151 | 0.204
| Plot | Mito | Lyso | Perox | ER | Golgi | PM | Cytosol | Nucleus | |||||
| Expt A |
5 peptides |
7 spectra |
|
0.000 0.000 | 0.000 |
0.000 0.000 | 0.000 |
0.090 0.015 | 0.158 |
0.142 0.050 | 0.216 |
0.114 0.000 | 0.231 |
0.289 0.179 | 0.385 |
0.184 0.120 | 0.236 |
0.181 0.151 | 0.204 |
| 2 spectra, VLDEVER | 0.000 | 0.000 | 0.020 | 0.282 | 0.000 | 0.278 | 0.279 | 0.142 | ||
| 1 spectrum, ENPYEDVDLK | 0.058 | 0.000 | 0.158 | 0.000 | 0.233 | 0.415 | 0.000 | 0.137 | ||
| 1 spectrum, VEQYLEELPDTEQSGMNK | 0.000 | 0.000 | 0.244 | 0.038 | 0.457 | 0.000 | 0.065 | 0.196 | ||
| 1 spectrum, GISAALVYPFMR | 0.000 | 0.000 | 0.000 | 0.241 | 0.117 | 0.225 | 0.160 | 0.257 | ||
| 2 spectra, AGGATGVAR | 0.000 | 0.000 | 0.130 | 0.000 | 0.156 | 0.264 | 0.307 | 0.143 |
| Plot | Mito | Lyso or Perox | ER | Golgi | PM | Cytosol | Nucleus | ||||||
| Expt B |
1 peptide |
1 spectrum |
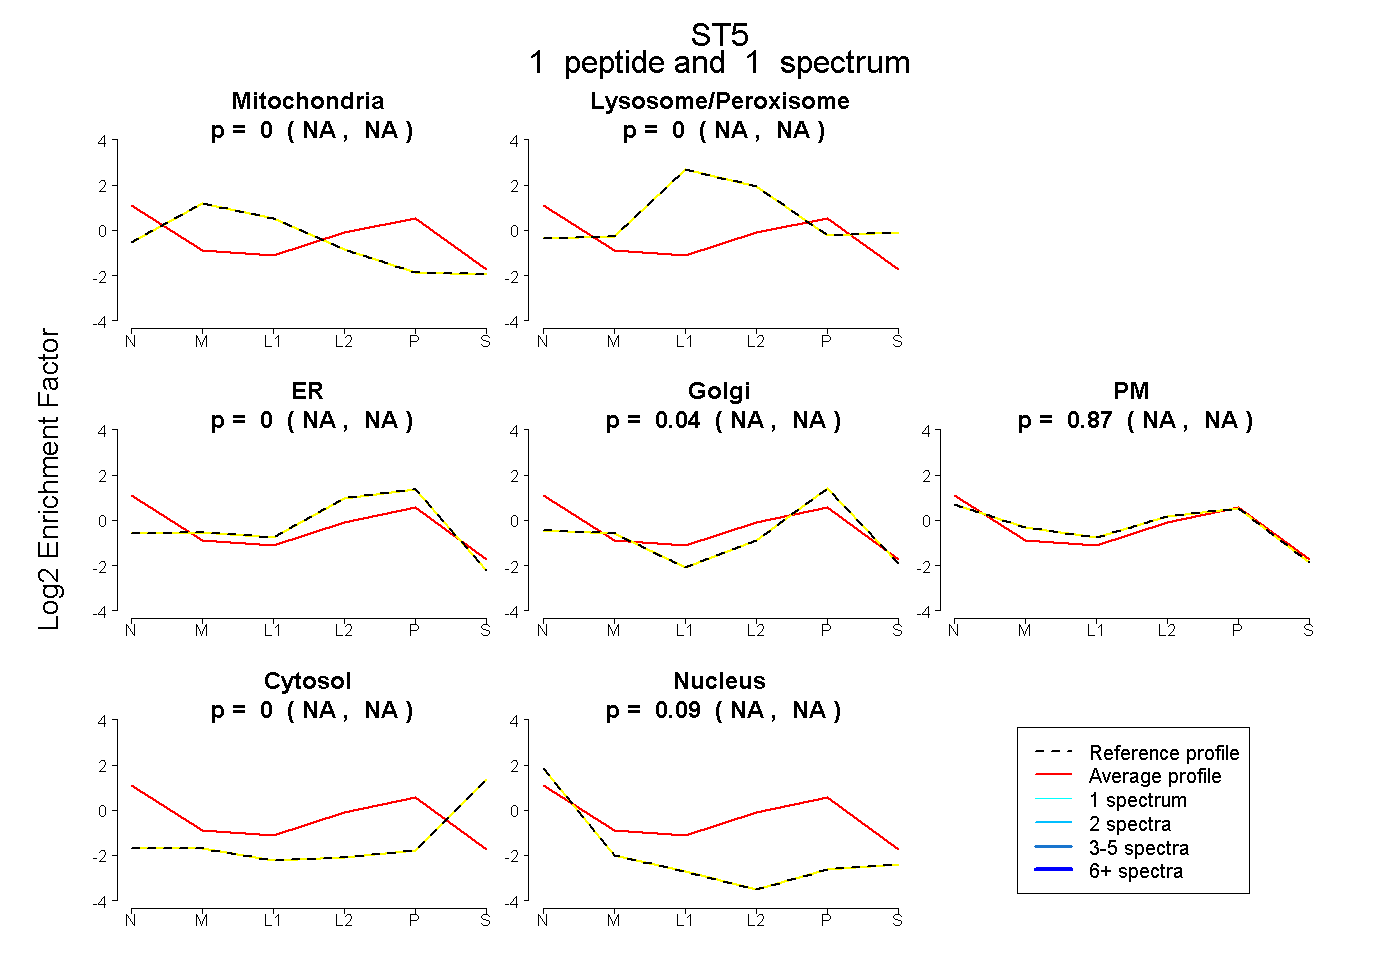 |
0.000 NA | NA |
0.000 NA | NA |
0.000 NA | NA |
0.044 NA | NA |
0.868 NA | NA |
0.000 NA | NA |
0.088 NA | NA |
|||
| Plot | Lyso | Other | |||||||||||
| Expt C |
1 peptide |
2 spectra |
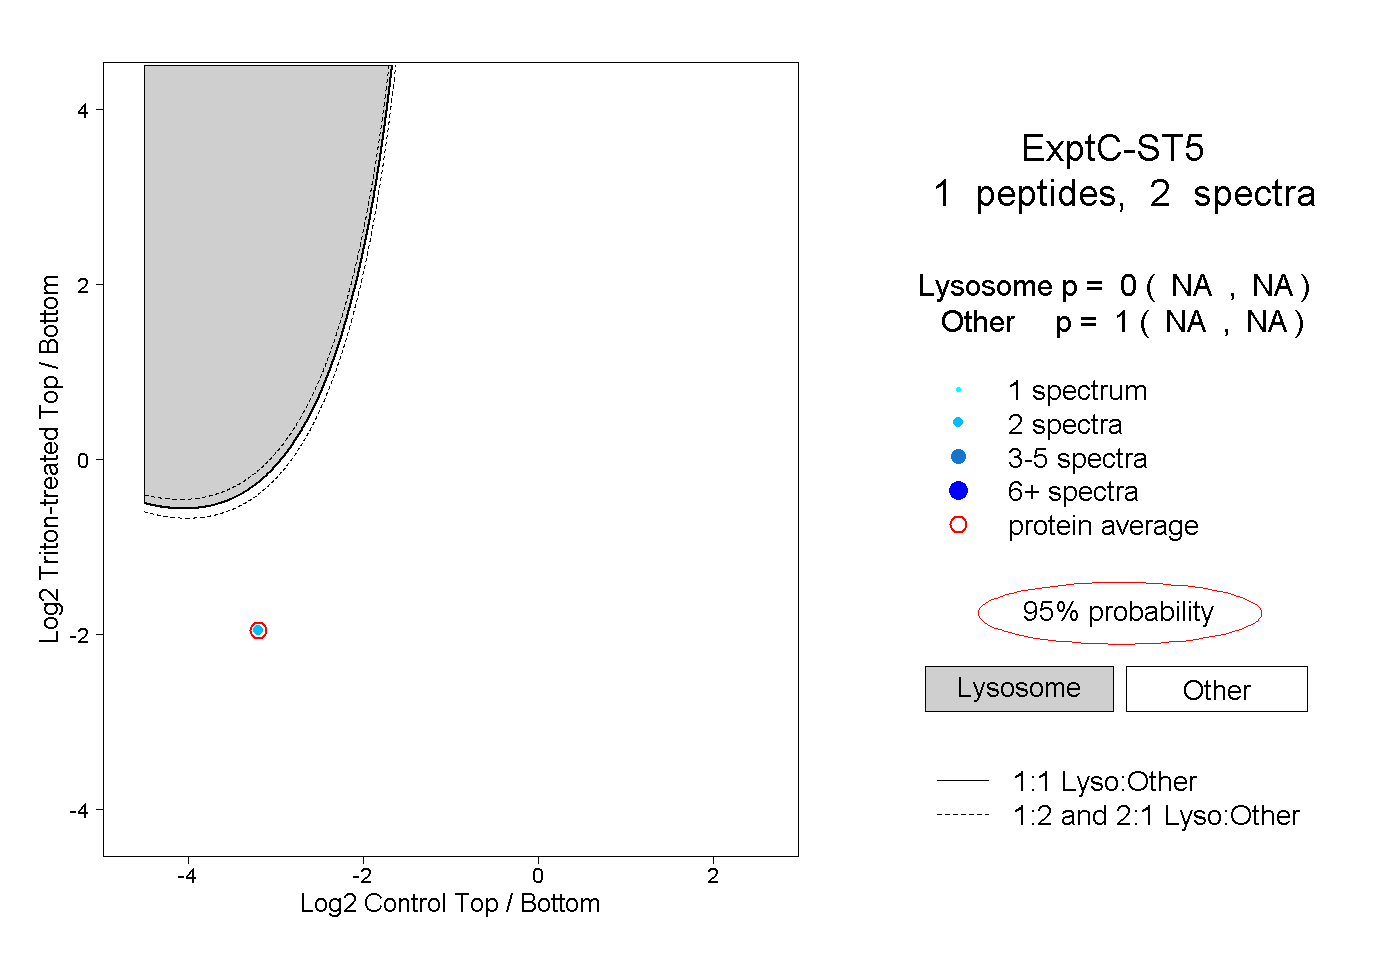 |
0.000 NA | NA |
1.000 NA | NA |
||||||||
| Plot | Lyso | Other | |||||||||||
| Expt D |
2 peptides |
2 spectra |
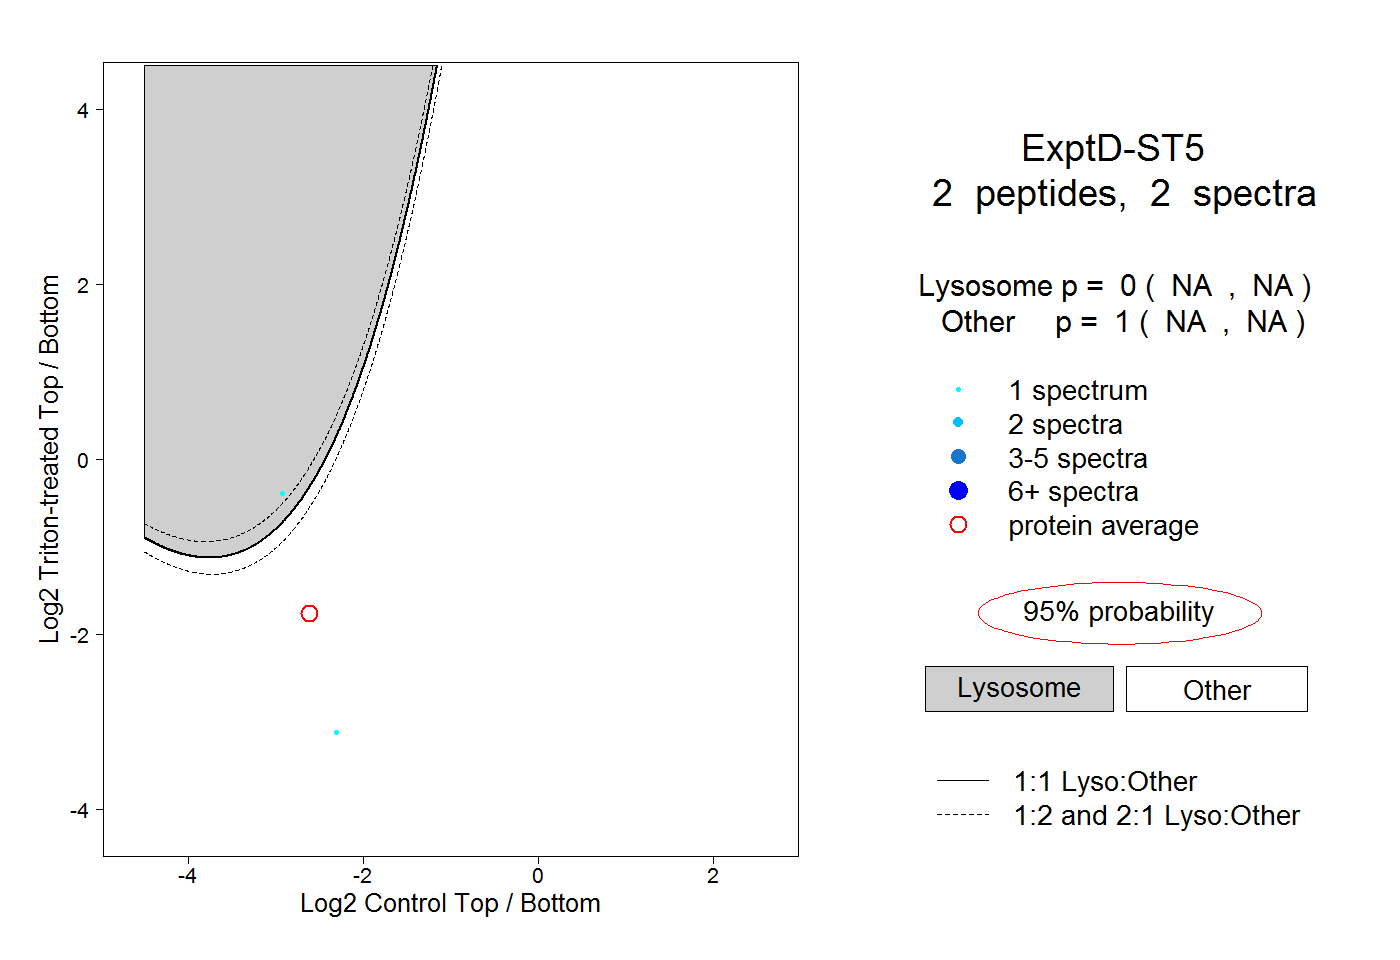 |
0.000 NA | NA |
1.000 NA | NA |