 2
2peptides
spectra
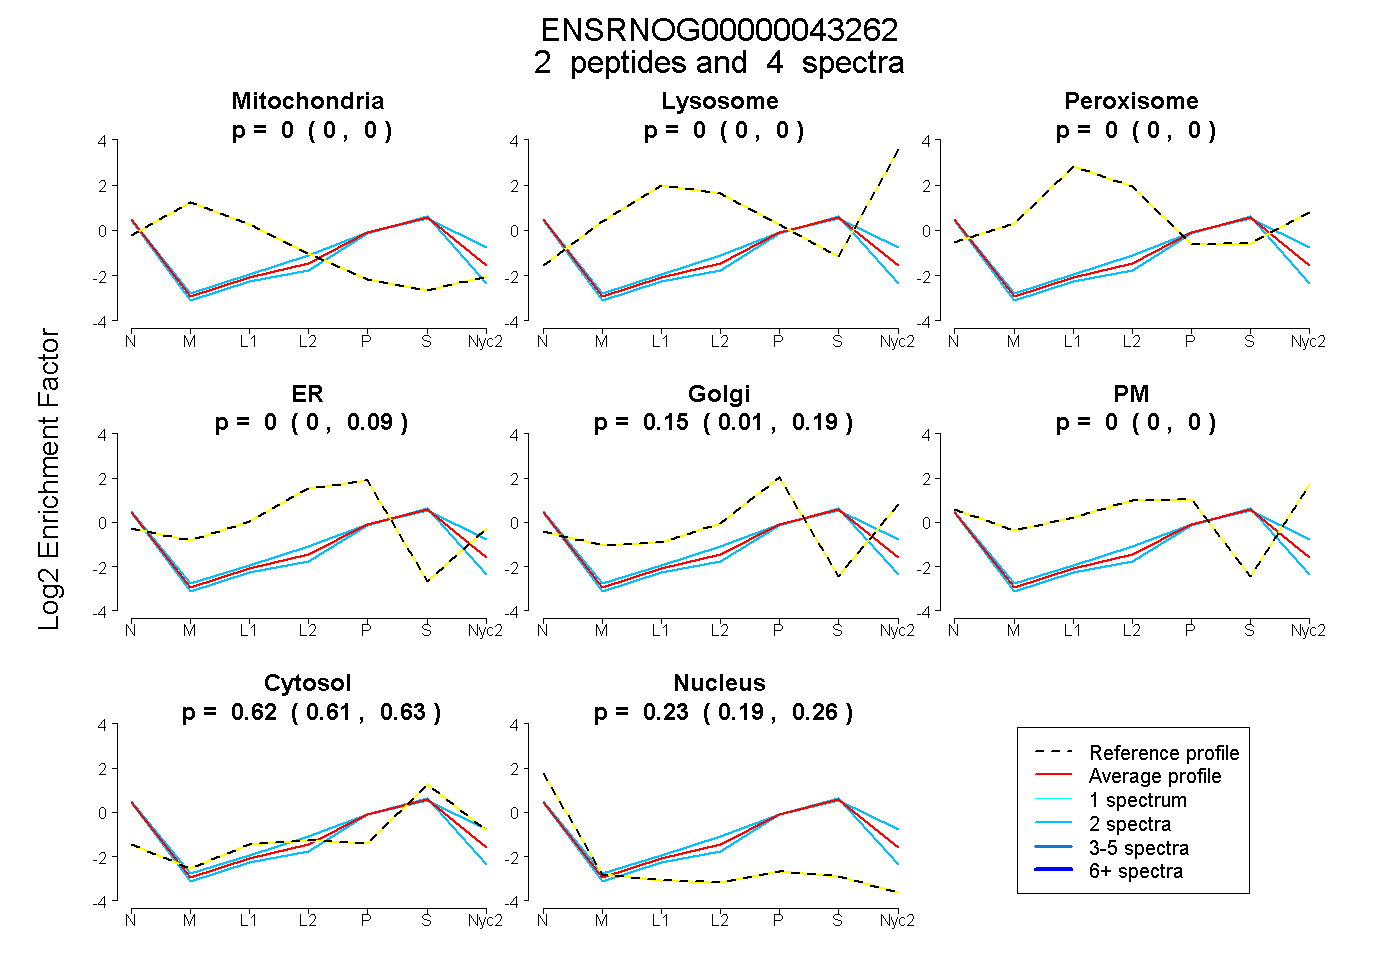
0.000 | 0.000
0.000 | 0.000
0.000 | 0.000
0.000 | 0.086
0.009 | 0.186
0.000 | 0.000
0.606 | 0.626
0.188 | 0.264
| Plot | Mito | Lyso | Perox | ER | Golgi | PM | Cytosol | Nucleus | |||||
| Expt A |
2 peptides |
4 spectra |
|
0.000 0.000 | 0.000 |
0.000 0.000 | 0.000 |
0.000 0.000 | 0.000 |
0.000 0.000 | 0.086 |
0.154 0.009 | 0.186 |
0.000 0.000 | 0.000 |
0.617 0.606 | 0.626 |
0.229 0.188 | 0.264 |
| 2 spectra, TVEPLEYYR | 0.000 | 0.000 | 0.000 | 0.018 | 0.053 | 0.000 | 0.621 | 0.308 | ||
| 2 spectra, ENCRPDGR | 0.000 | 0.000 | 0.000 | 0.000 | 0.237 | 0.000 | 0.613 | 0.150 |
| Plot | Lyso | Other | |||||||||||
| Expt C |
1 peptide |
2 spectra |
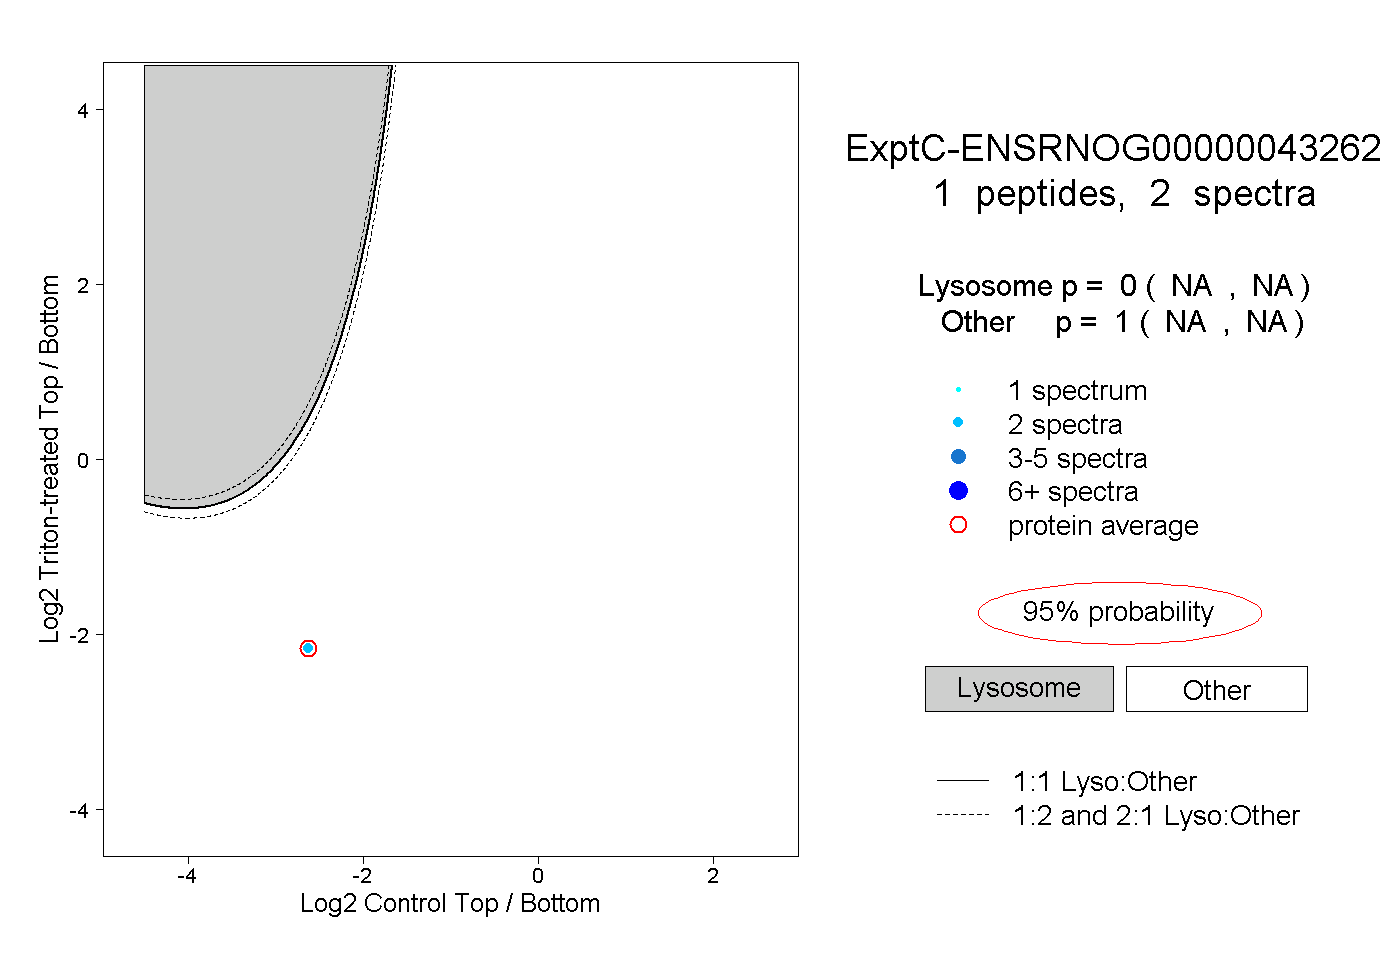 |
0.000 NA | NA |
1.000 NA | NA |