 4
4peptides
spectra
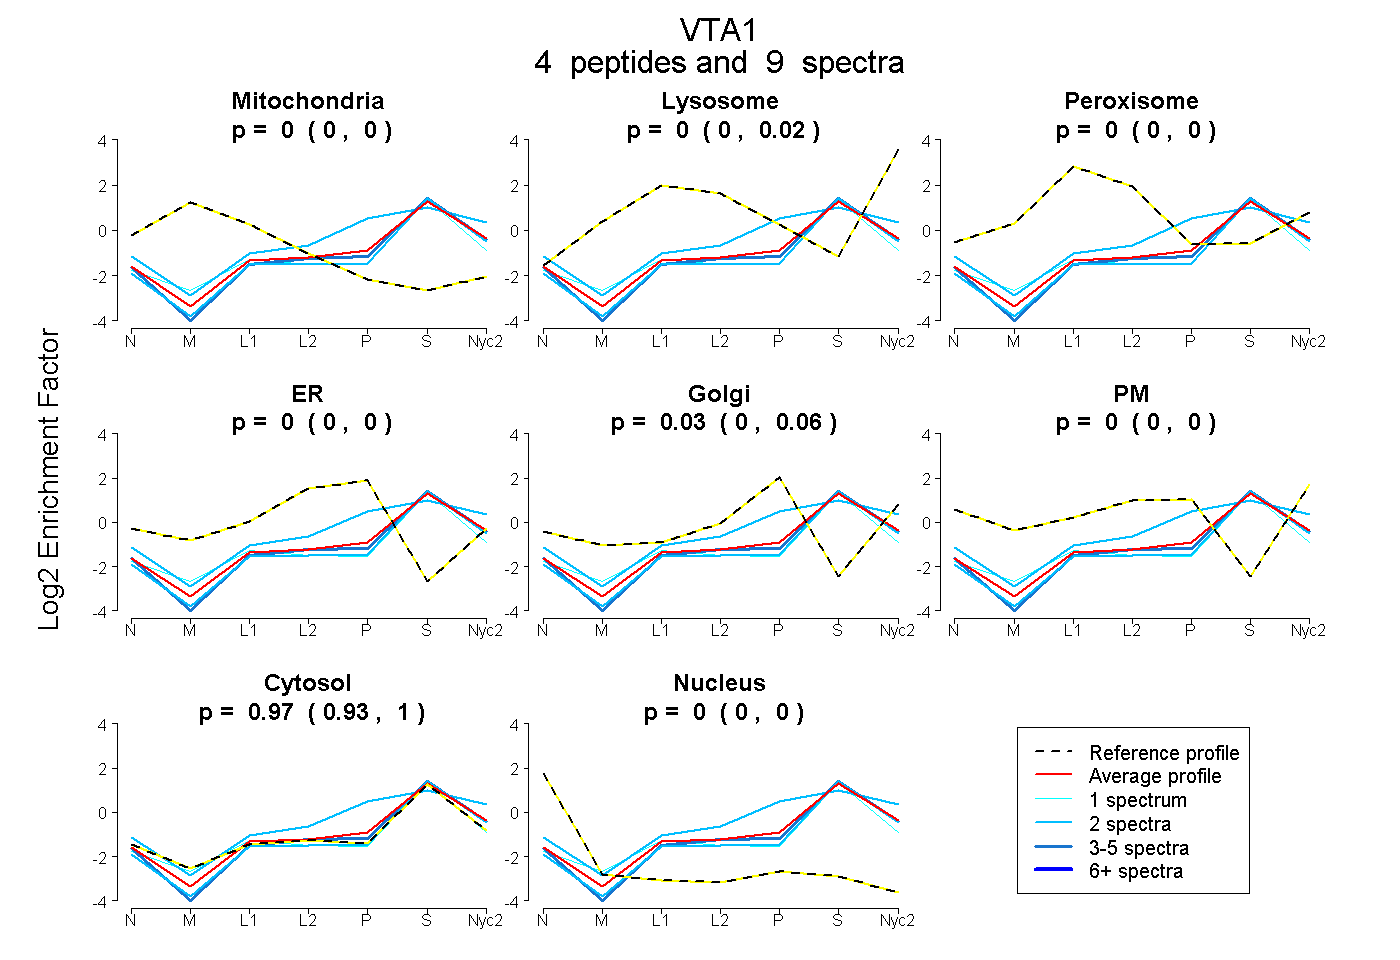
0.000 | 0.000
0.000 | 0.022
0.000 | 0.000
0.000 | 0.000
0.000 | 0.059
0.000 | 0.000
0.933 | 0.996
0.000 | 0.000
1peptide
spectra
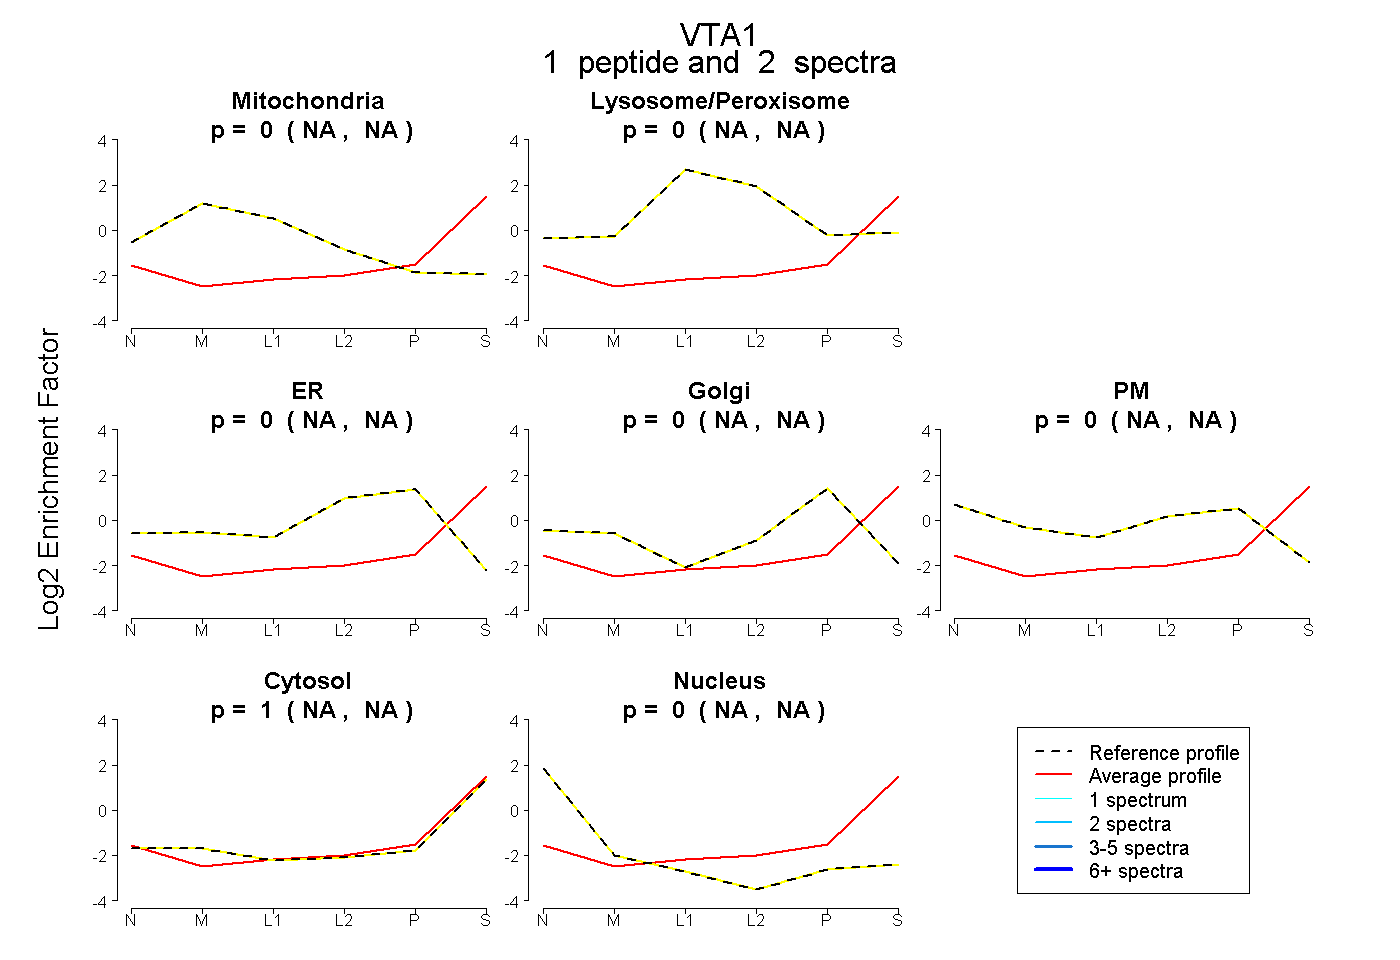
NA | NA
NA | NA
NA | NA
NA | NA
NA | NA
NA | NA
NA | NA
3peptides
spectra
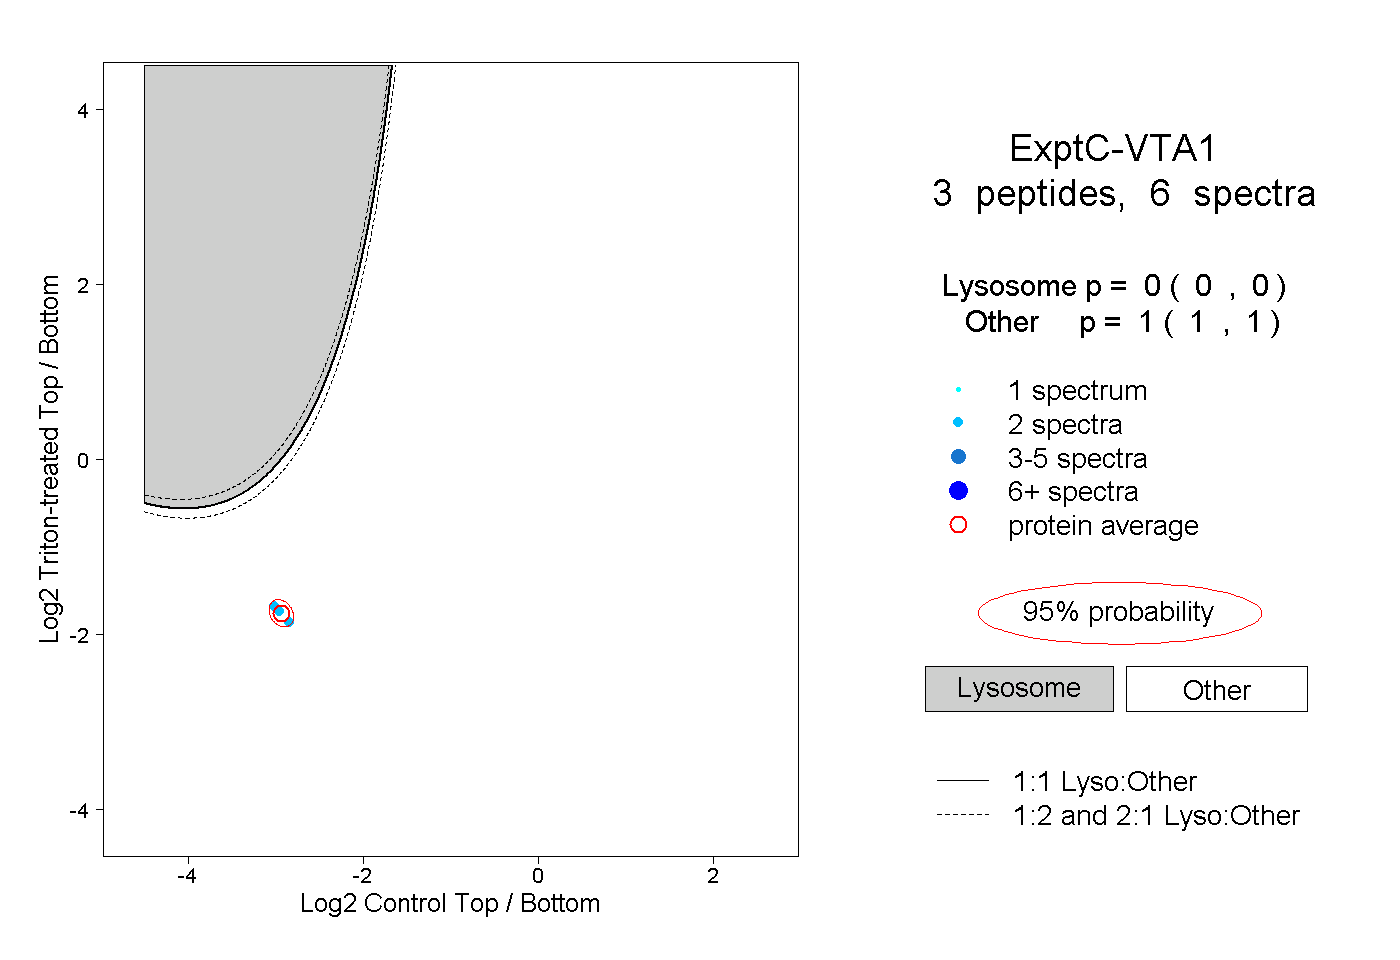
0.000 | 0.000
1.000 | 1.000
2peptides
spectra
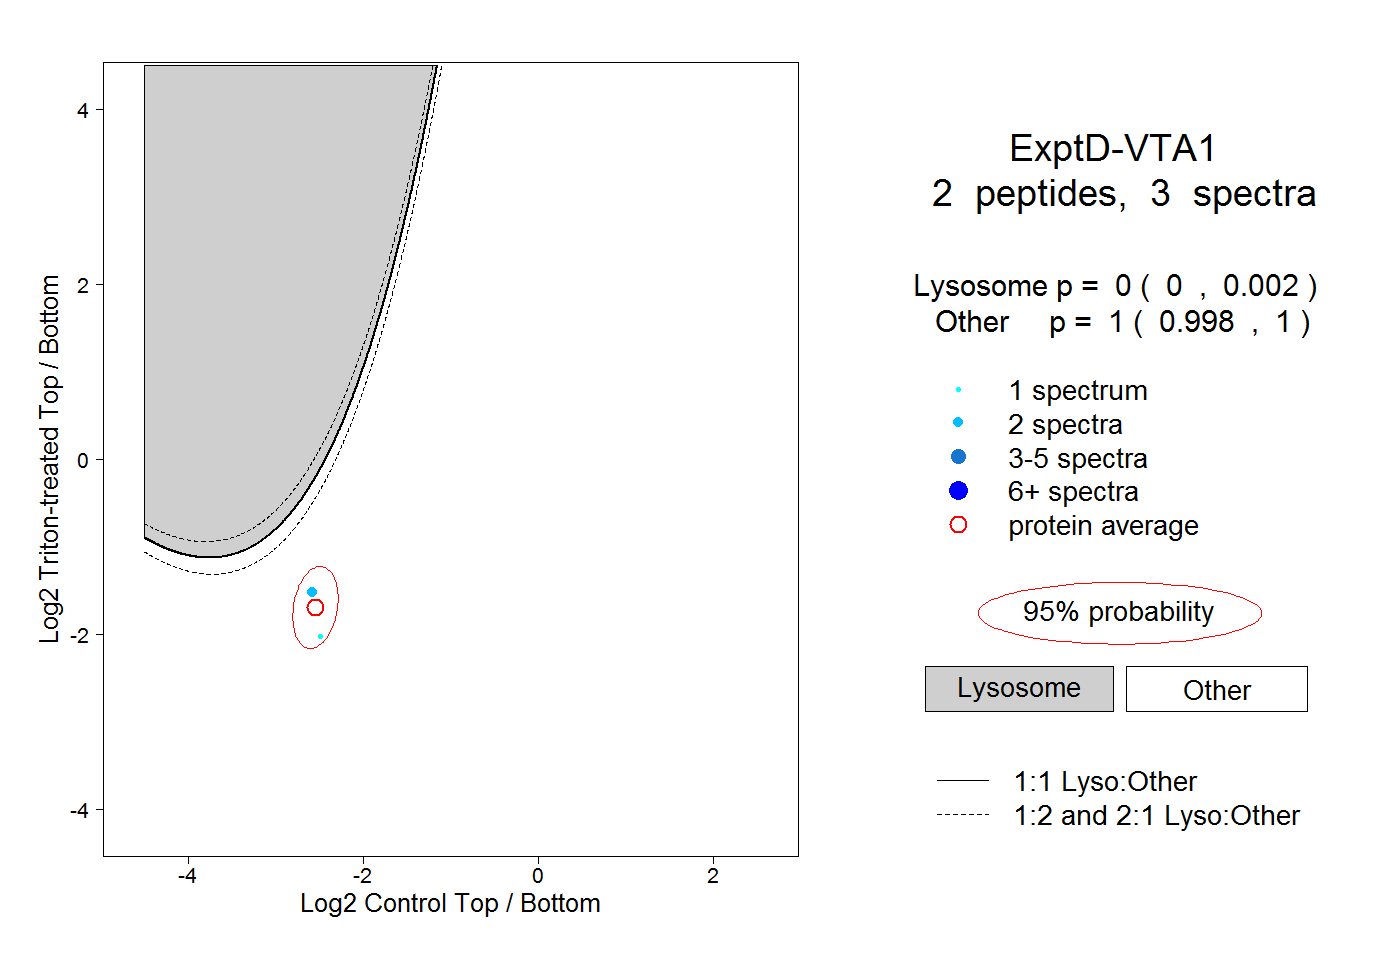
0.000 | 0.002
0.998 | 1.000