 23
23peptides
spectra
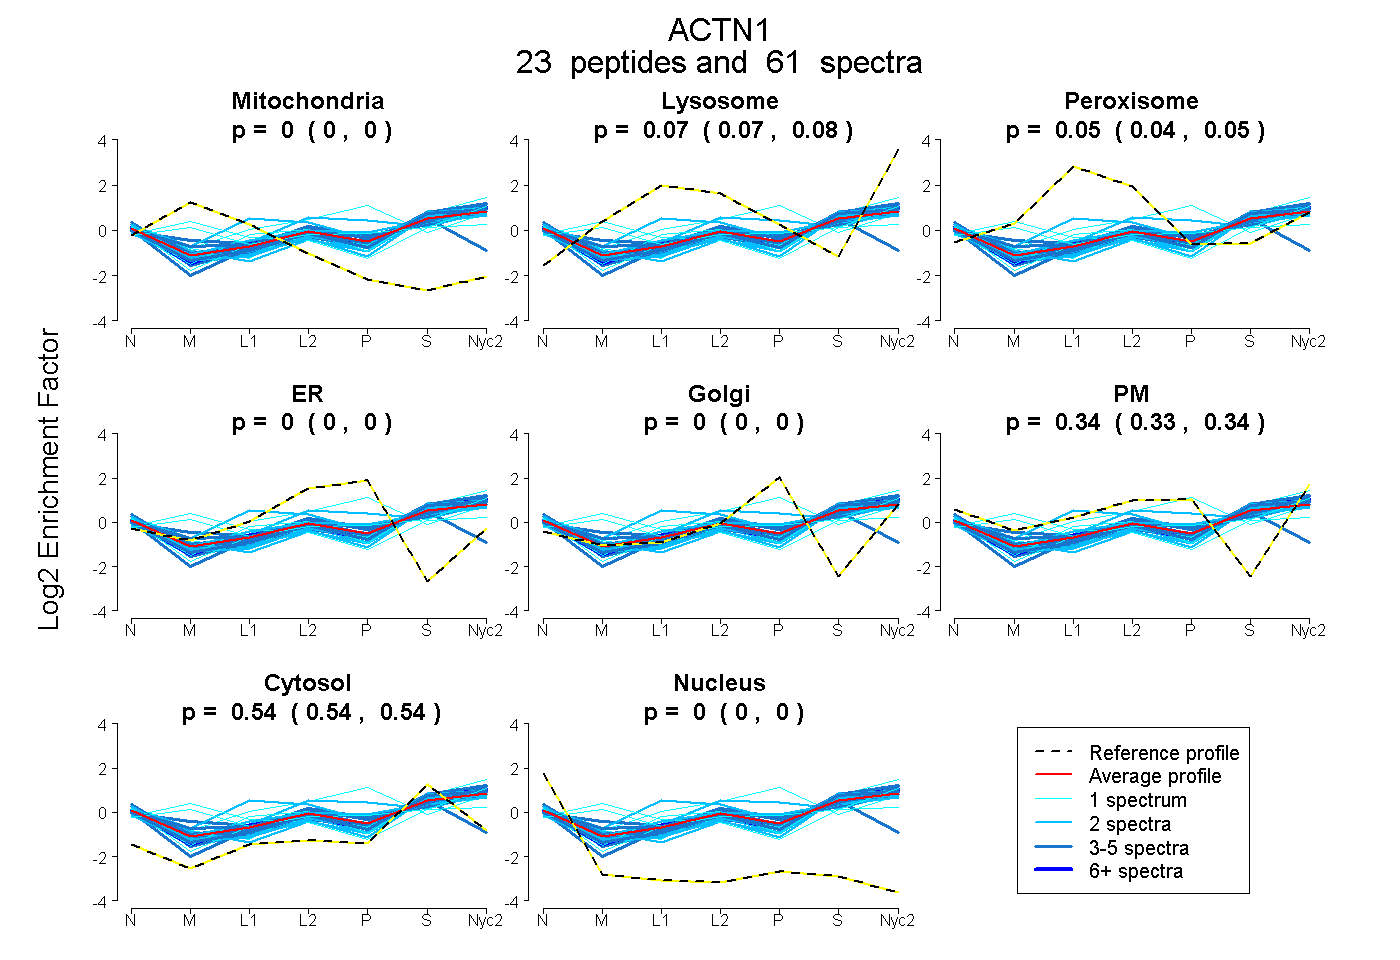
0.000 | 0.000
0.067 | 0.081
0.040 | 0.054
0.000 | 0.000
0.000 | 0.000
0.333 | 0.341
0.538 | 0.543
0.000 | 0.000
6peptides
spectra
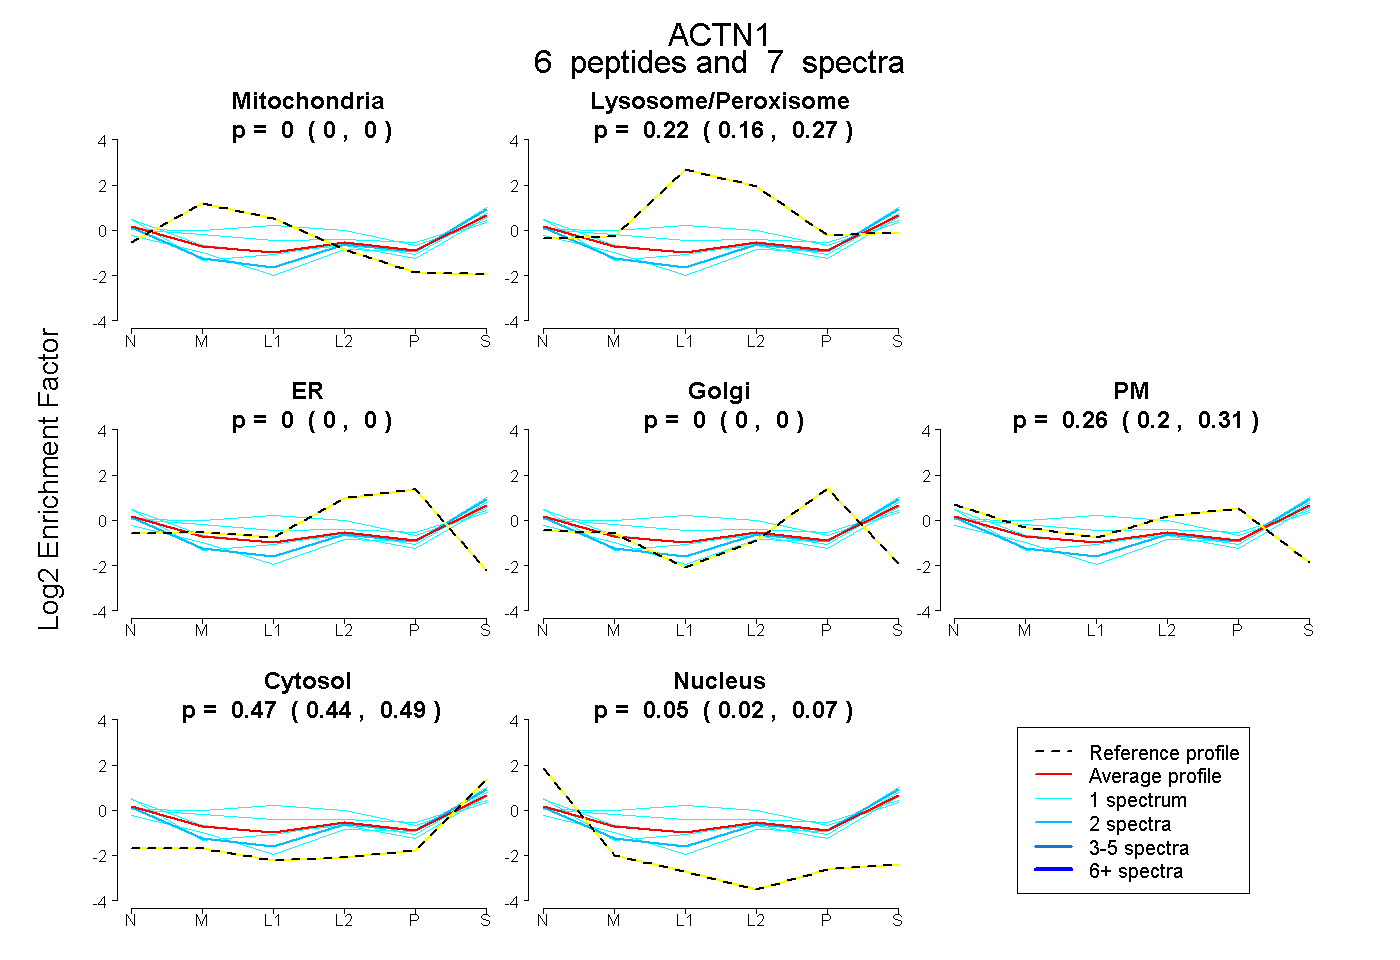
0.000 | 0.000
0.162 | 0.269
0.000 | 0.000
0.000 | 0.000
0.196 | 0.314
0.439 | 0.493
0.020 | 0.073
18peptides
spectra
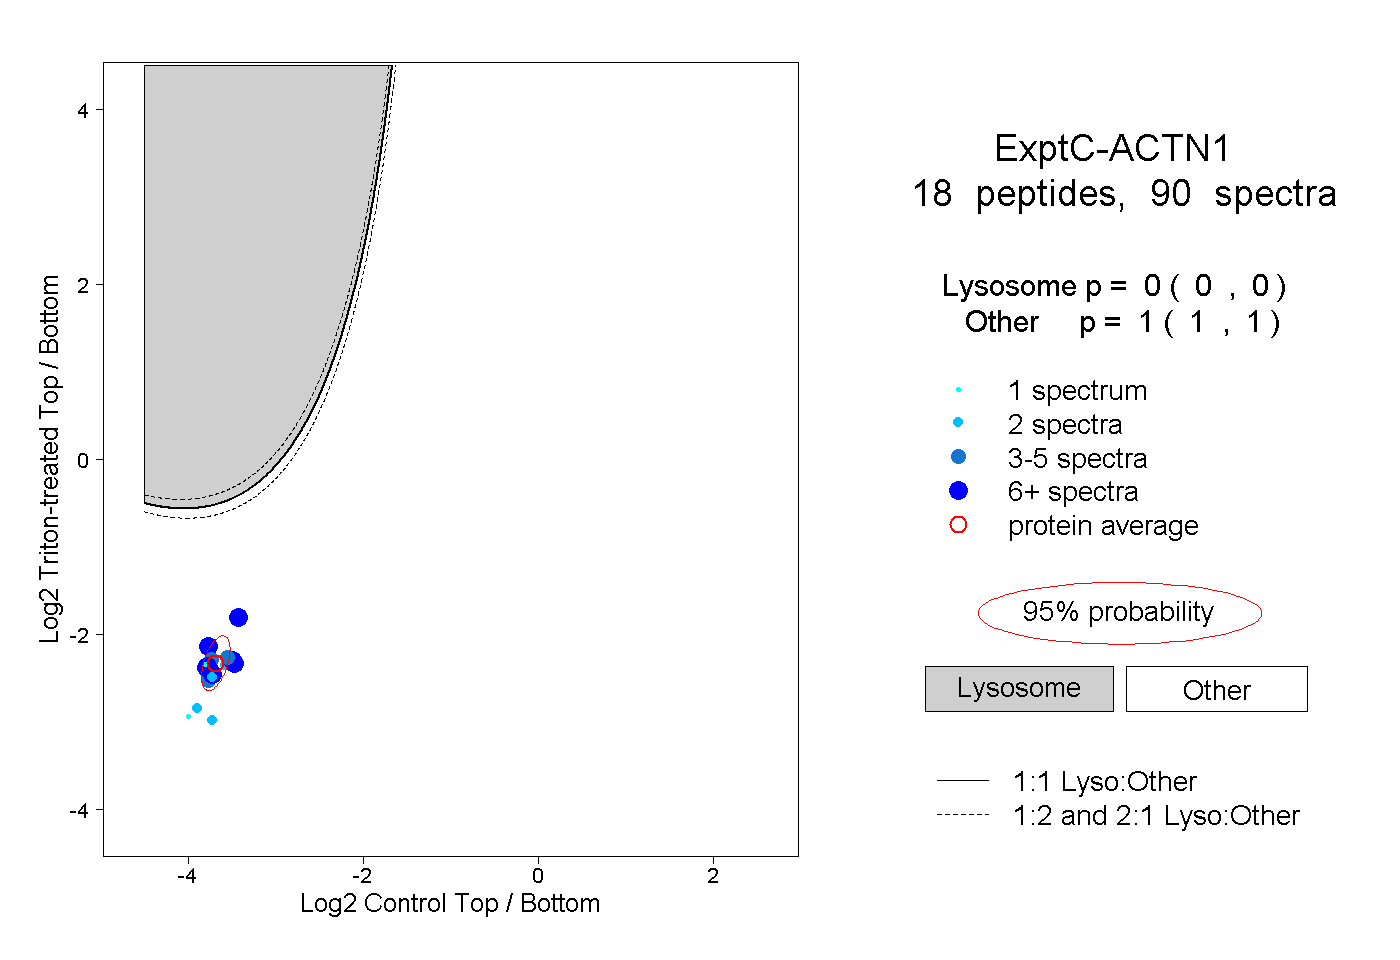
0.000 | 0.000
1.000 | 1.000
4peptides
spectra
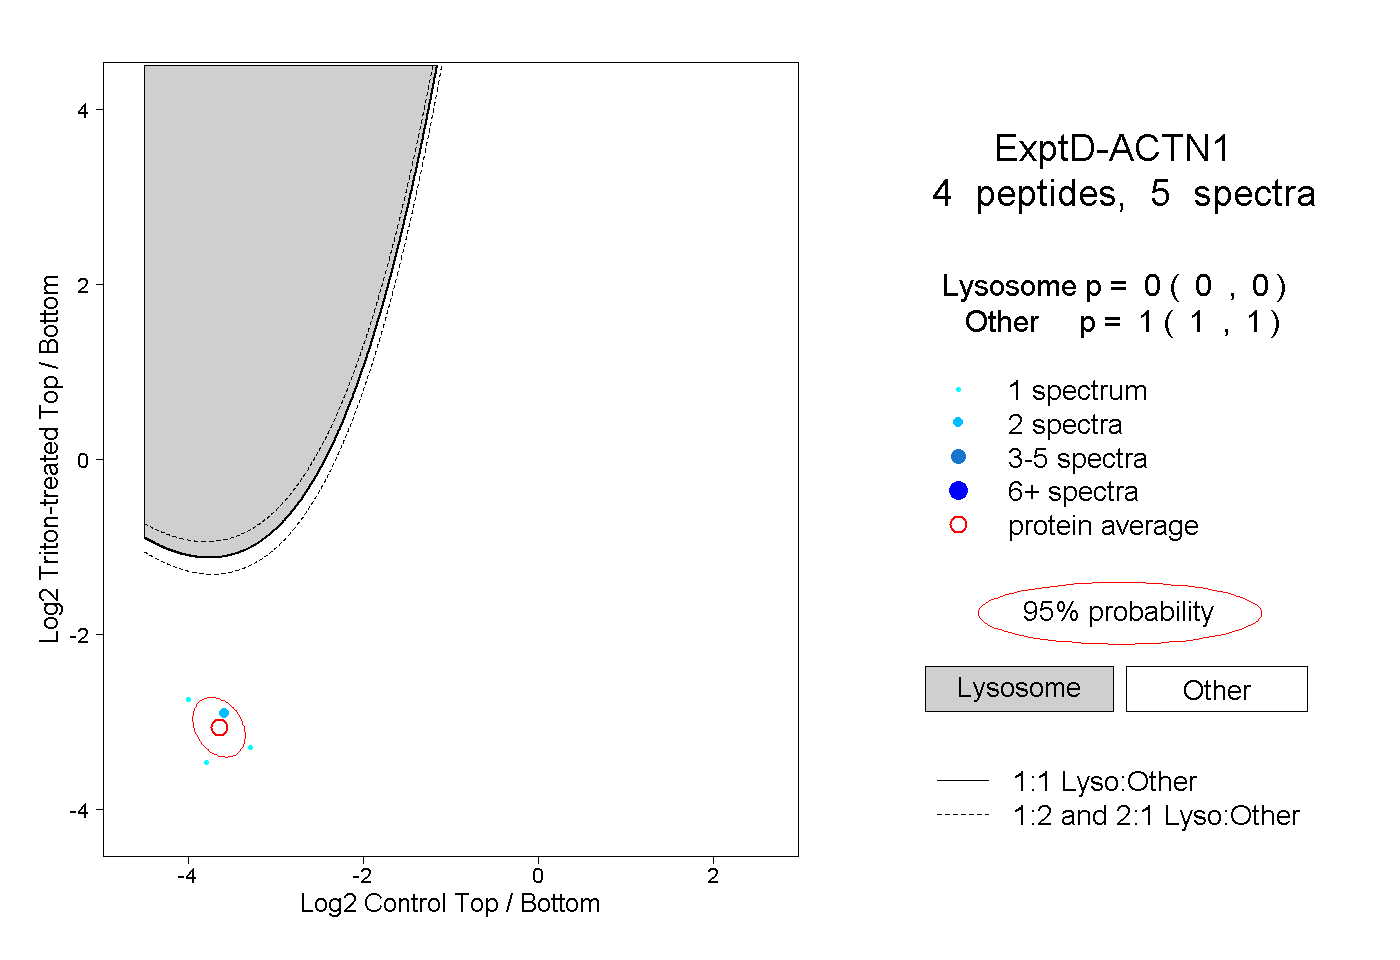
0.000 | 0.000
1.000 | 1.000