 7
7peptides
spectra
0.000 | 0.000
0.047 | 0.096
0.009 | 0.062
0.000 | 0.008
0.637 | 0.707
0.000 | 0.055
0.168 | 0.200
0.000 | 0.000
| Plot | Mito | Lyso | Perox | ER | Golgi | PM | Cytosol | Nucleus | |||||
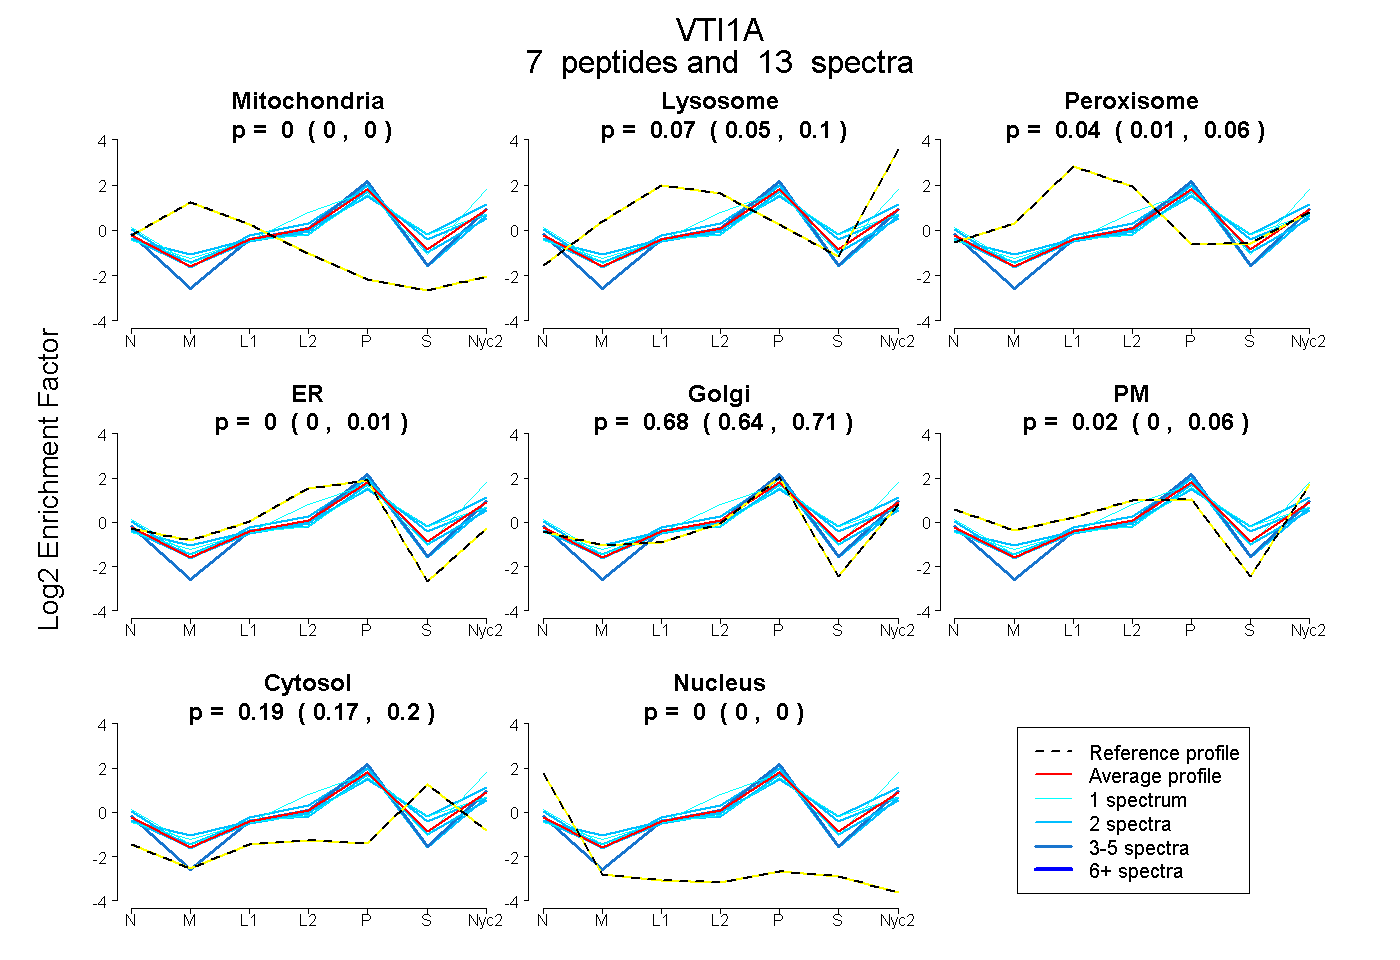
| Expt A |
7 peptides |
13 spectra |
|
0.000 0.000 | 0.000 |
0.074 0.047 | 0.096 |
0.039 0.009 | 0.062 |
0.000 0.000 | 0.008 |
0.680 0.637 | 0.707 |
0.021 0.000 | 0.055 |
0.186 0.168 | 0.200 |
0.000 0.000 | 0.000 |
| 1 spectrum, QMVANVEK | 0.000 | 0.096 | 0.052 | 0.000 | 0.563 | 0.000 | 0.289 | 0.000 | ||
| 2 spectra, AHLLDNTER | 0.000 | 0.062 | 0.061 | 0.000 | 0.621 | 0.000 | 0.257 | 0.000 | ||
| 2 spectra, EIPPQSR | 0.000 | 0.000 | 0.024 | 0.163 | 0.584 | 0.125 | 0.105 | 0.000 | ||
| 2 spectra, IAYSDEVR | 0.000 | 0.000 | 0.050 | 0.038 | 0.728 | 0.000 | 0.184 | 0.000 | ||
| 2 spectra, ETDANLGK | 0.000 | 0.216 | 0.000 | 0.000 | 0.514 | 0.000 | 0.270 | 0.000 | ||
| 3 spectra, ELLEQMDLEVR | 0.000 | 0.002 | 0.000 | 0.035 | 0.831 | 0.000 | 0.132 | 0.000 | ||
| 1 spectrum, ILTGMLR | 0.000 | 0.115 | 0.000 | 0.000 | 0.406 | 0.365 | 0.114 | 0.000 |
| Plot | Mito | Lyso or Perox | ER | Golgi | PM | Cytosol | Nucleus | ||||||
| Expt B |
1 peptide |
2 spectra |
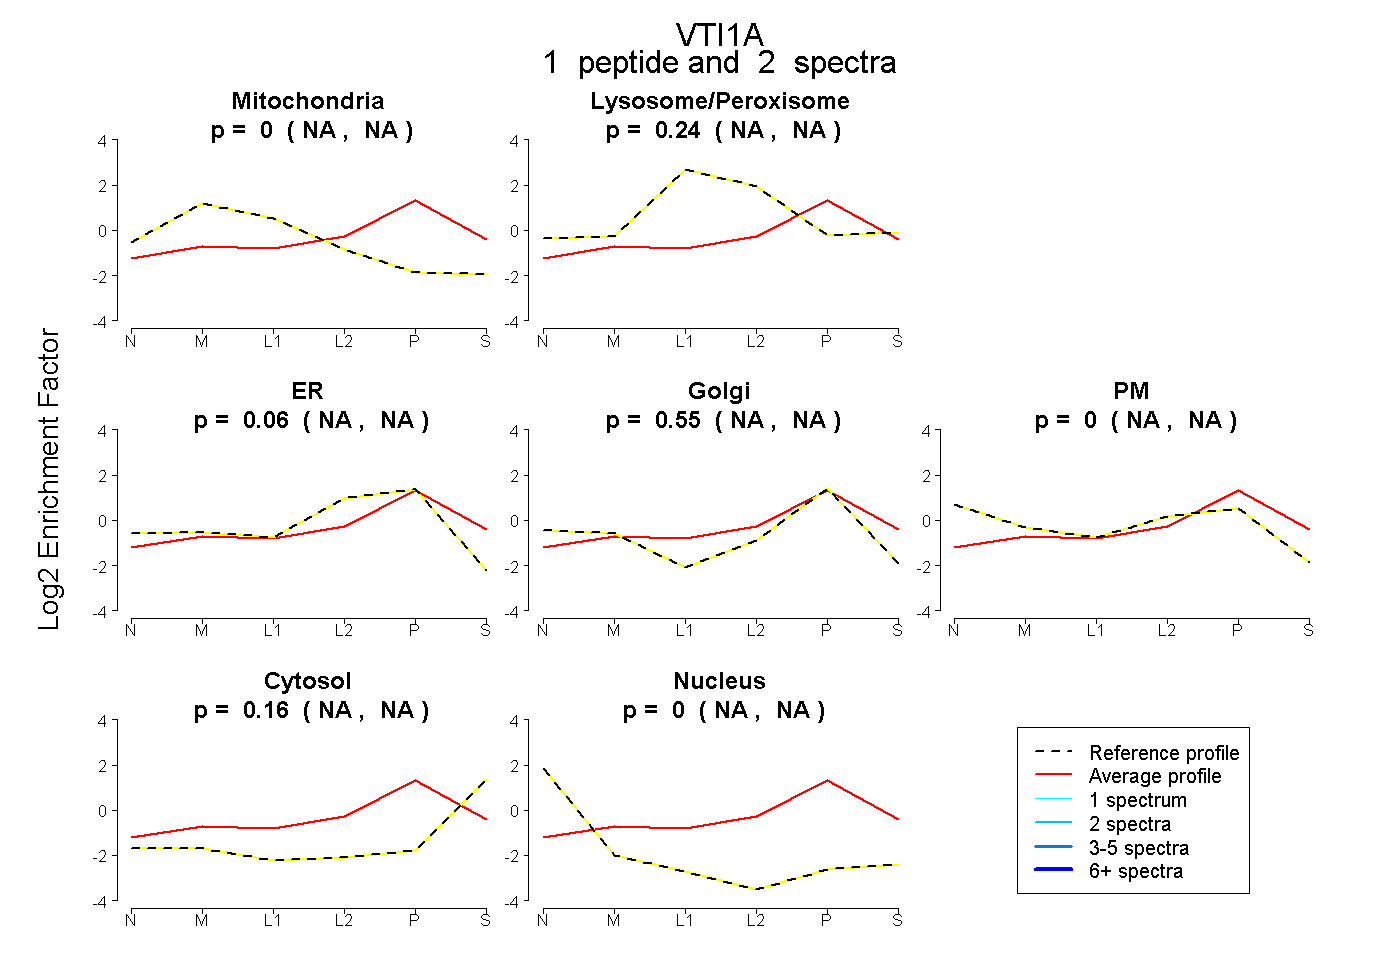 |
0.000 NA | NA |
0.239 NA | NA |
0.055 NA | NA |
0.546 NA | NA |
0.000 NA | NA |
0.159 NA | NA |
0.000 NA | NA |
|||
| Plot | Lyso | Other | |||||||||||
| Expt C |
5 peptides |
15 spectra |
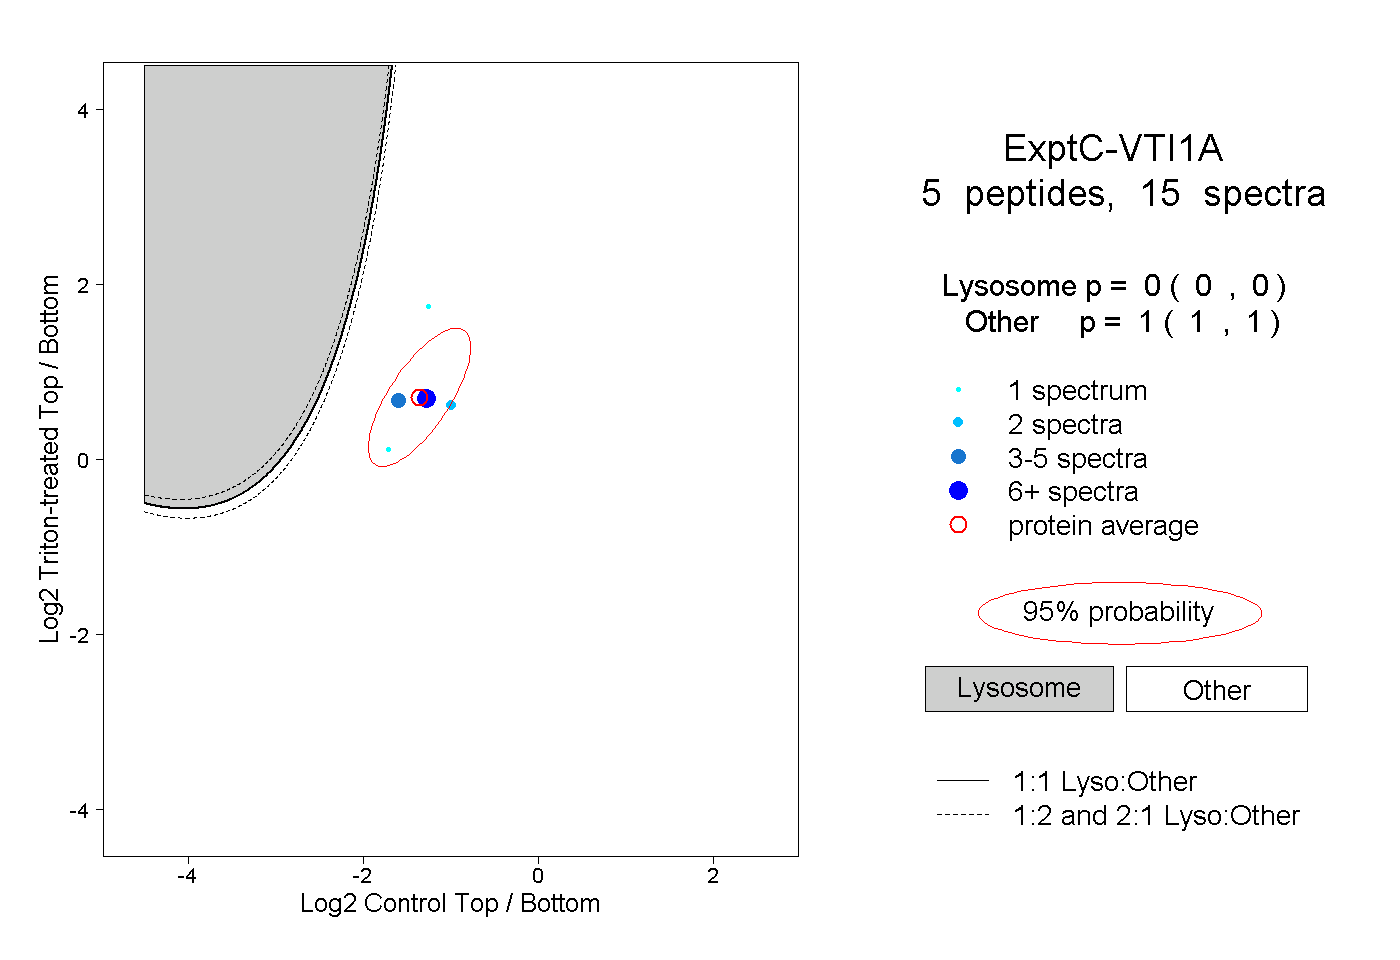 |
0.000 0.000 | 0.000 |
1.000 1.000 | 1.000 |