 2
2peptides
spectra
0.000 | 0.000
0.000 | 0.027
0.000 | 0.075
0.000 | 0.299
0.000 | 0.353
0.000 | 0.172
0.581 | 0.795
0.000 | 0.033
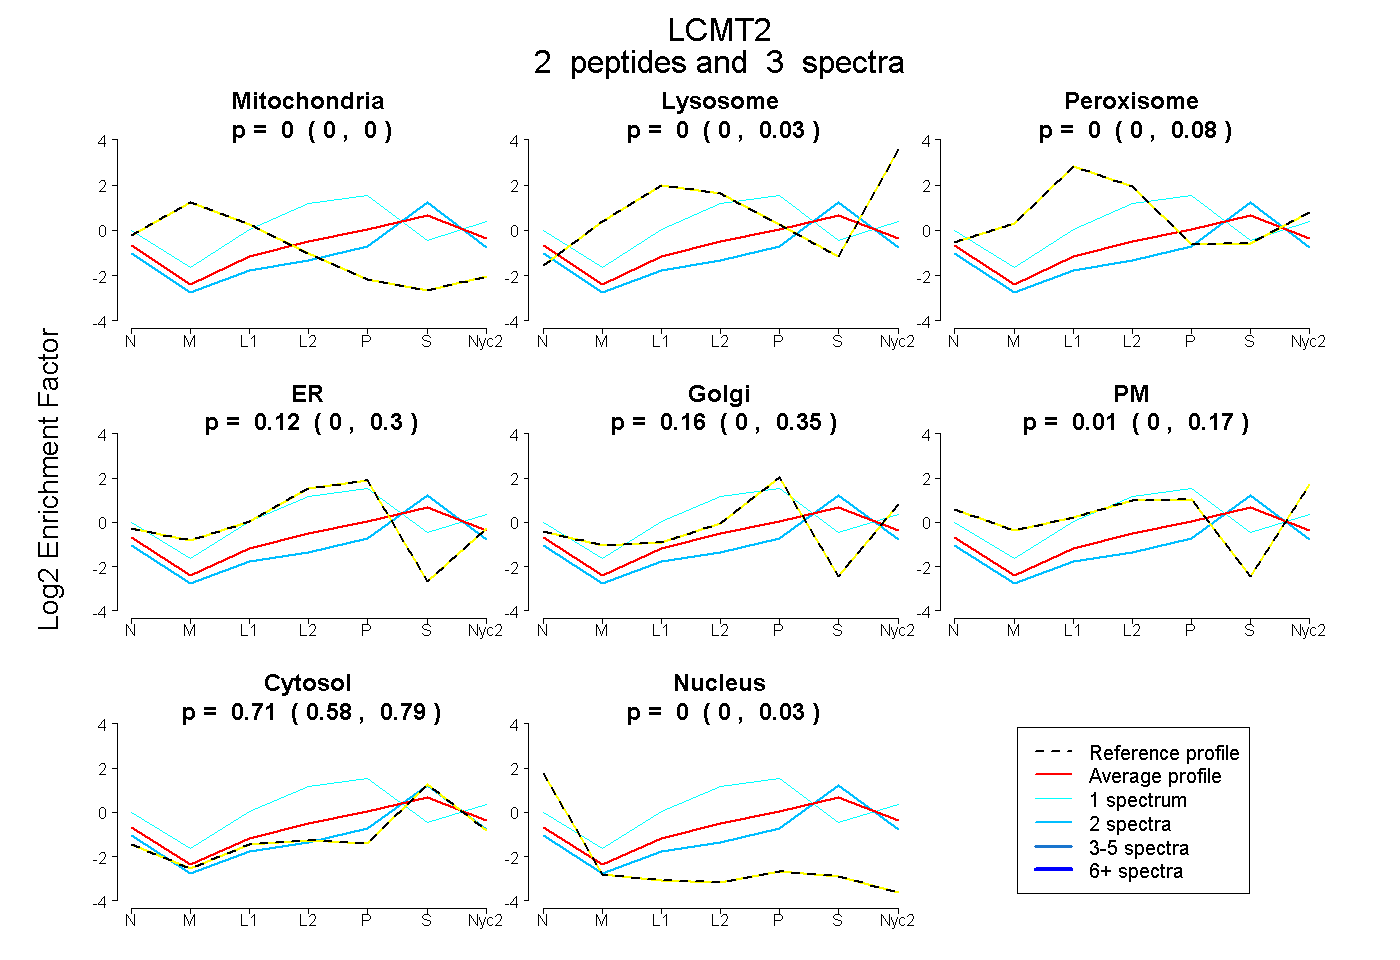
| Plot | Mito | Lyso | Perox | ER | Golgi | PM | Cytosol | Nucleus | |||||
| Expt A |
2 peptides |
3 spectra |
|
0.000 0.000 | 0.000 |
0.000 0.000 | 0.027 |
0.000 0.000 | 0.075 |
0.125 0.000 | 0.299 |
0.157 0.000 | 0.353 |
0.012 0.000 | 0.172 |
0.706 0.581 | 0.795 |
0.000 0.000 | 0.033 |
| 1 spectrum, FLHVETMAWVR | 0.000 | 0.058 | 0.039 | 0.499 | 0.000 | 0.142 | 0.262 | 0.000 | ||
| 2 spectra, VLVLGGR | 0.000 | 0.000 | 0.000 | 0.000 | 0.072 | 0.000 | 0.914 | 0.015 |