 22
22peptides
spectra
0.972 | 0.974
0.000 | 0.000
0.000 | 0.000
0.000 | 0.000
0.000 | 0.000
0.000 | 0.000
0.000 | 0.000
0.026 | 0.028
| Plot | Mito | Lyso | Perox | ER | Golgi | PM | Cytosol | Nucleus | |||||
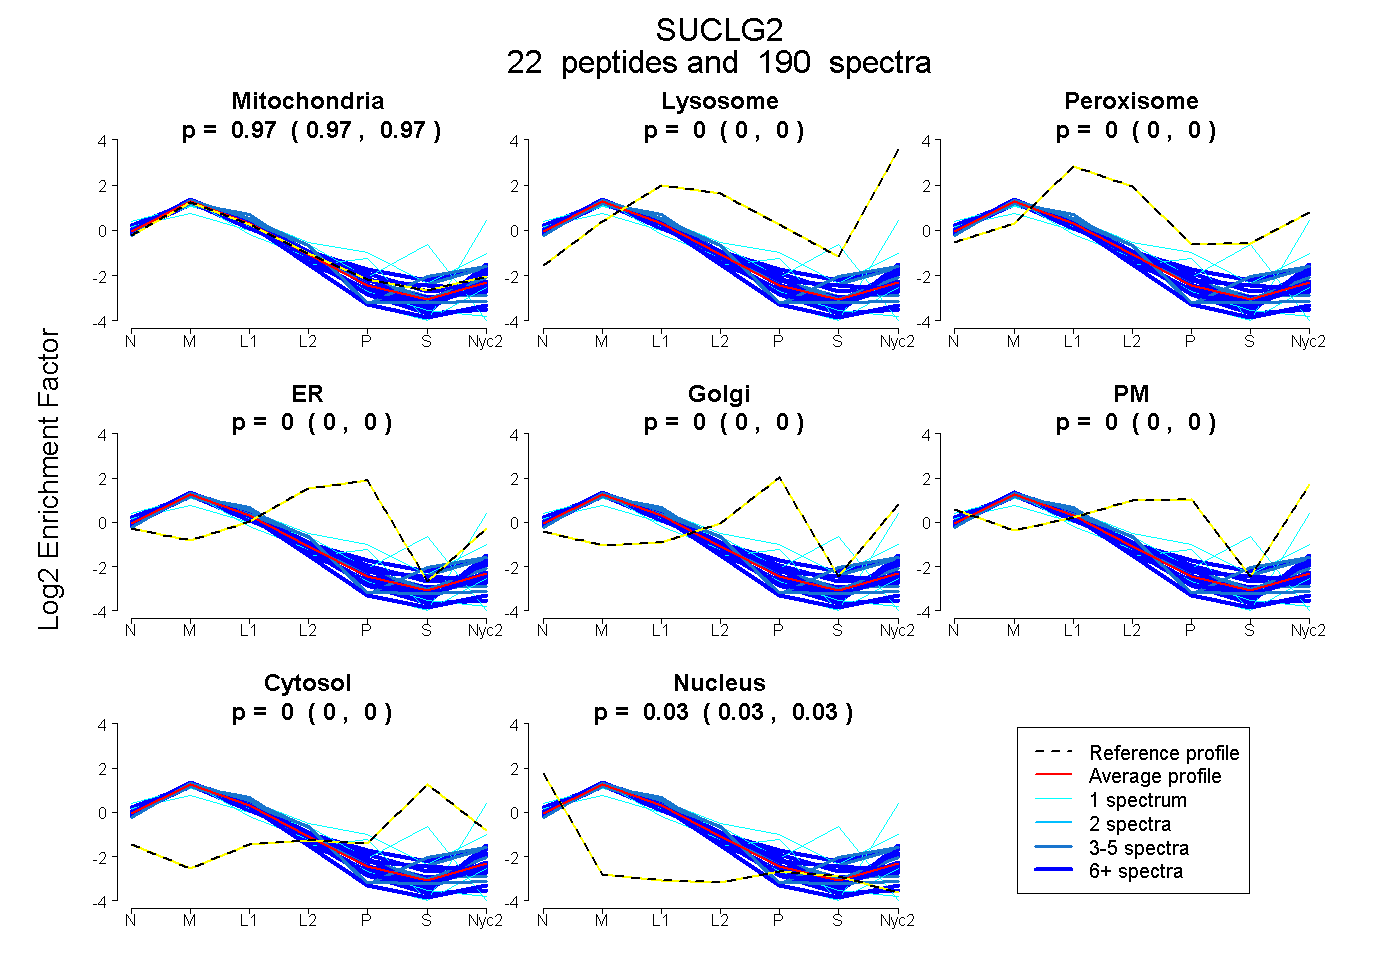
| Expt A |
22 peptides |
190 spectra |
|
0.973 0.972 | 0.974 |
0.000 0.000 | 0.000 |
0.000 0.000 | 0.000 |
0.000 0.000 | 0.000 |
0.000 0.000 | 0.000 |
0.000 0.000 | 0.000 |
0.000 0.000 | 0.000 |
0.027 0.026 | 0.028 |
| 20 spectra, FFVASTAK | 0.954 | 0.000 | 0.000 | 0.019 | 0.000 | 0.000 | 0.000 | 0.027 | ||
| 10 spectra, AQILAGGR | 0.854 | 0.000 | 0.059 | 0.000 | 0.005 | 0.058 | 0.024 | 0.000 | ||
| 18 spectra, ETYLAILMDR | 0.979 | 0.000 | 0.000 | 0.000 | 0.000 | 0.000 | 0.000 | 0.021 | ||
| 9 spectra, ACQELELK | 0.914 | 0.000 | 0.000 | 0.000 | 0.000 | 0.000 | 0.000 | 0.086 | ||
| 4 spectra, VVGQLAQQMIGYNLATK | 0.988 | 0.000 | 0.000 | 0.000 | 0.000 | 0.000 | 0.000 | 0.012 | ||
| 1 spectrum, SENEPIENEAAR | 0.925 | 0.000 | 0.000 | 0.000 | 0.000 | 0.000 | 0.000 | 0.075 | ||
| 18 spectra, VPLVVR | 0.898 | 0.000 | 0.000 | 0.000 | 0.000 | 0.000 | 0.000 | 0.102 | ||
| 15 spectra, VMVAEALDISR | 0.971 | 0.000 | 0.000 | 0.000 | 0.000 | 0.000 | 0.000 | 0.029 | ||
| 1 spectrum, NQAADQIK | 0.867 | 0.000 | 0.000 | 0.000 | 0.000 | 0.000 | 0.000 | 0.133 | ||
| 1 spectrum, GVFDSGLK | 0.634 | 0.000 | 0.000 | 0.000 | 0.000 | 0.366 | 0.000 | 0.000 | ||
| 1 spectrum, LEGTNVQEAQNILK | 0.752 | 0.000 | 0.000 | 0.000 | 0.000 | 0.000 | 0.175 | 0.072 | ||
| 4 spectra, LLTSDPK | 0.952 | 0.000 | 0.000 | 0.000 | 0.000 | 0.007 | 0.000 | 0.041 | ||
| 4 spectra, SSGLPITSAVDLEDAAK | 0.911 | 0.000 | 0.059 | 0.000 | 0.000 | 0.000 | 0.031 | 0.000 | ||
| 7 spectra, DIFAMDDK | 0.935 | 0.000 | 0.000 | 0.000 | 0.000 | 0.052 | 0.000 | 0.013 | ||
| 11 spectra, EQIDIFEGIK | 0.974 | 0.000 | 0.000 | 0.000 | 0.000 | 0.000 | 0.000 | 0.026 | ||
| 18 spectra, INFDDNAEFR | 0.959 | 0.000 | 0.000 | 0.000 | 0.000 | 0.025 | 0.000 | 0.016 | ||
| 1 spectrum, EAQEAAK | 0.688 | 0.000 | 0.065 | 0.000 | 0.008 | 0.239 | 0.000 | 0.000 | ||
| 4 spectra, AVASVAK | 0.922 | 0.000 | 0.000 | 0.000 | 0.000 | 0.000 | 0.000 | 0.078 | ||
| 4 spectra, LMSEHGVR | 0.915 | 0.000 | 0.085 | 0.000 | 0.000 | 0.000 | 0.000 | 0.000 | ||
| 10 spectra, ESQVYQAFK | 0.956 | 0.000 | 0.000 | 0.000 | 0.000 | 0.000 | 0.000 | 0.044 | ||
| 8 spectra, MAENLGFLGSLK | 0.960 | 0.000 | 0.000 | 0.000 | 0.000 | 0.000 | 0.000 | 0.040 | ||
| 21 spectra, LYHLFLK | 0.951 | 0.000 | 0.000 | 0.000 | 0.000 | 0.049 | 0.000 | 0.000 |
| Plot | Mito | Lyso or Perox | ER | Golgi | PM | Cytosol | Nucleus | ||||||
| Expt B |
18 peptides |
125 spectra |
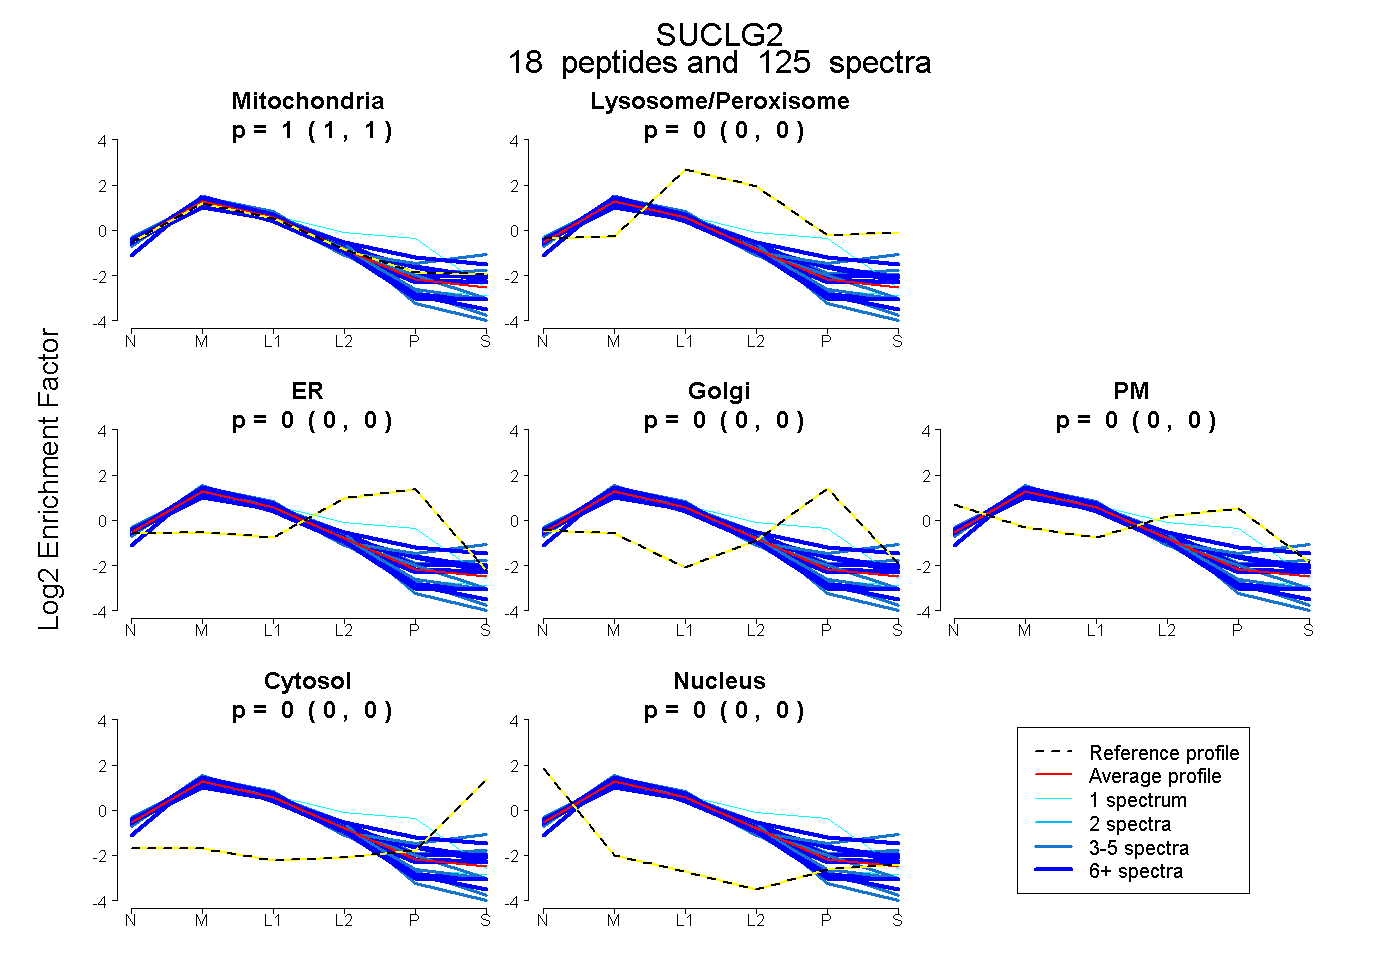 |
1.000 1.000 | 1.000 |
0.000 0.000 | 0.000 |
0.000 0.000 | 0.000 |
0.000 0.000 | 0.000 |
0.000 0.000 | 0.000 |
0.000 0.000 | 0.000 |
0.000 0.000 | 0.000 |
|||
| Plot | Lyso | Other | |||||||||||
| Expt C |
23 peptides |
874 spectra |
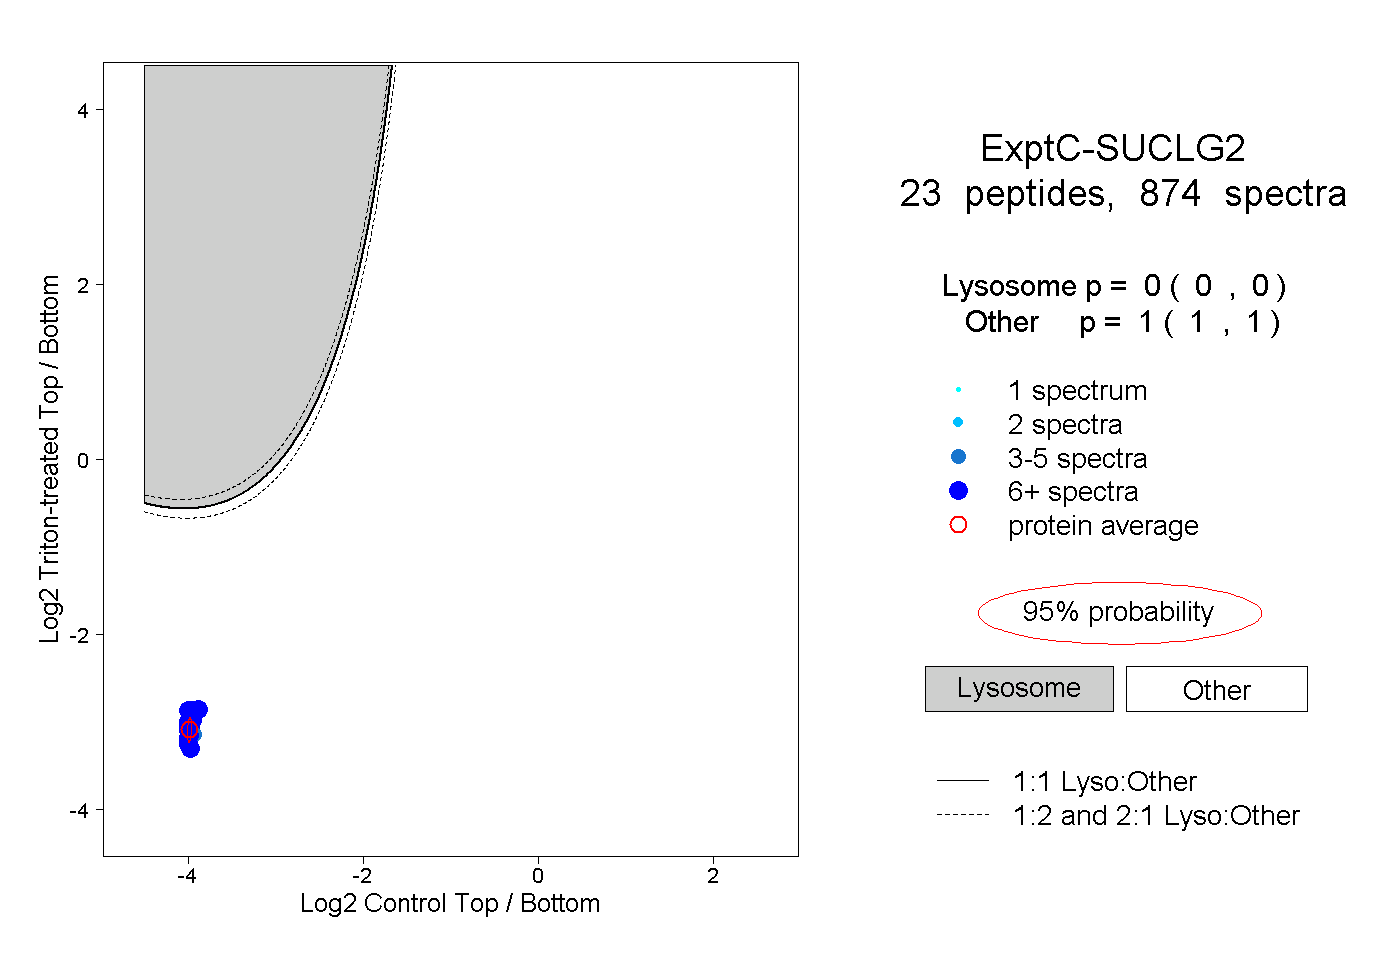 |
0.000 0.000 | 0.000 |
1.000 1.000 | 1.000 |
||||||||
| Plot | Lyso | Other | |||||||||||
| Expt D |
15 peptides |
42 spectra |
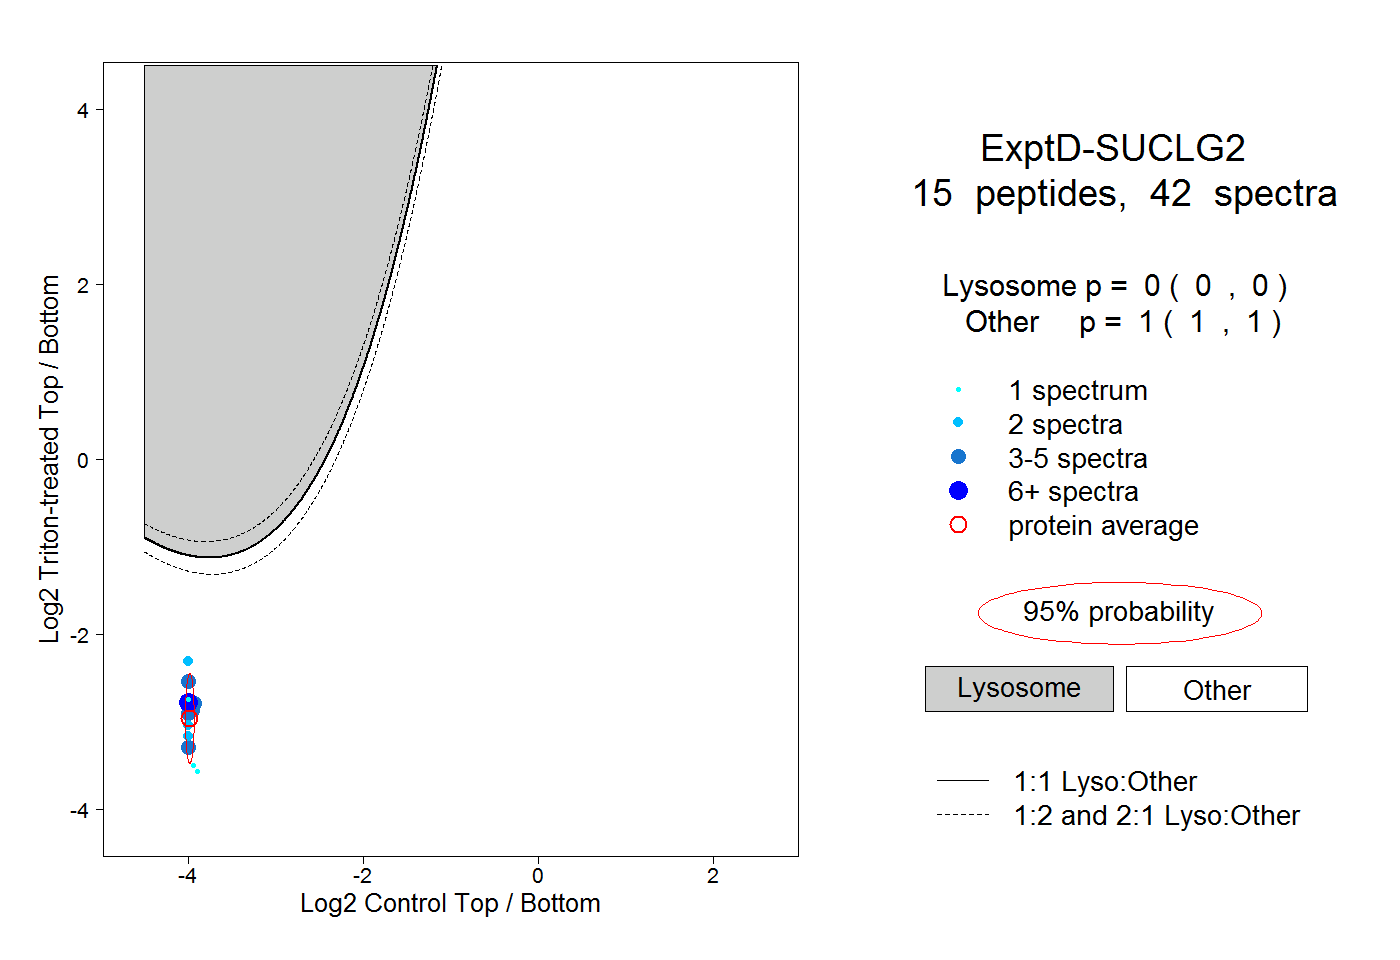 |
0.000 0.000 | 0.000 |
1.000 1.000 | 1.000 |