 3
3peptides
spectra
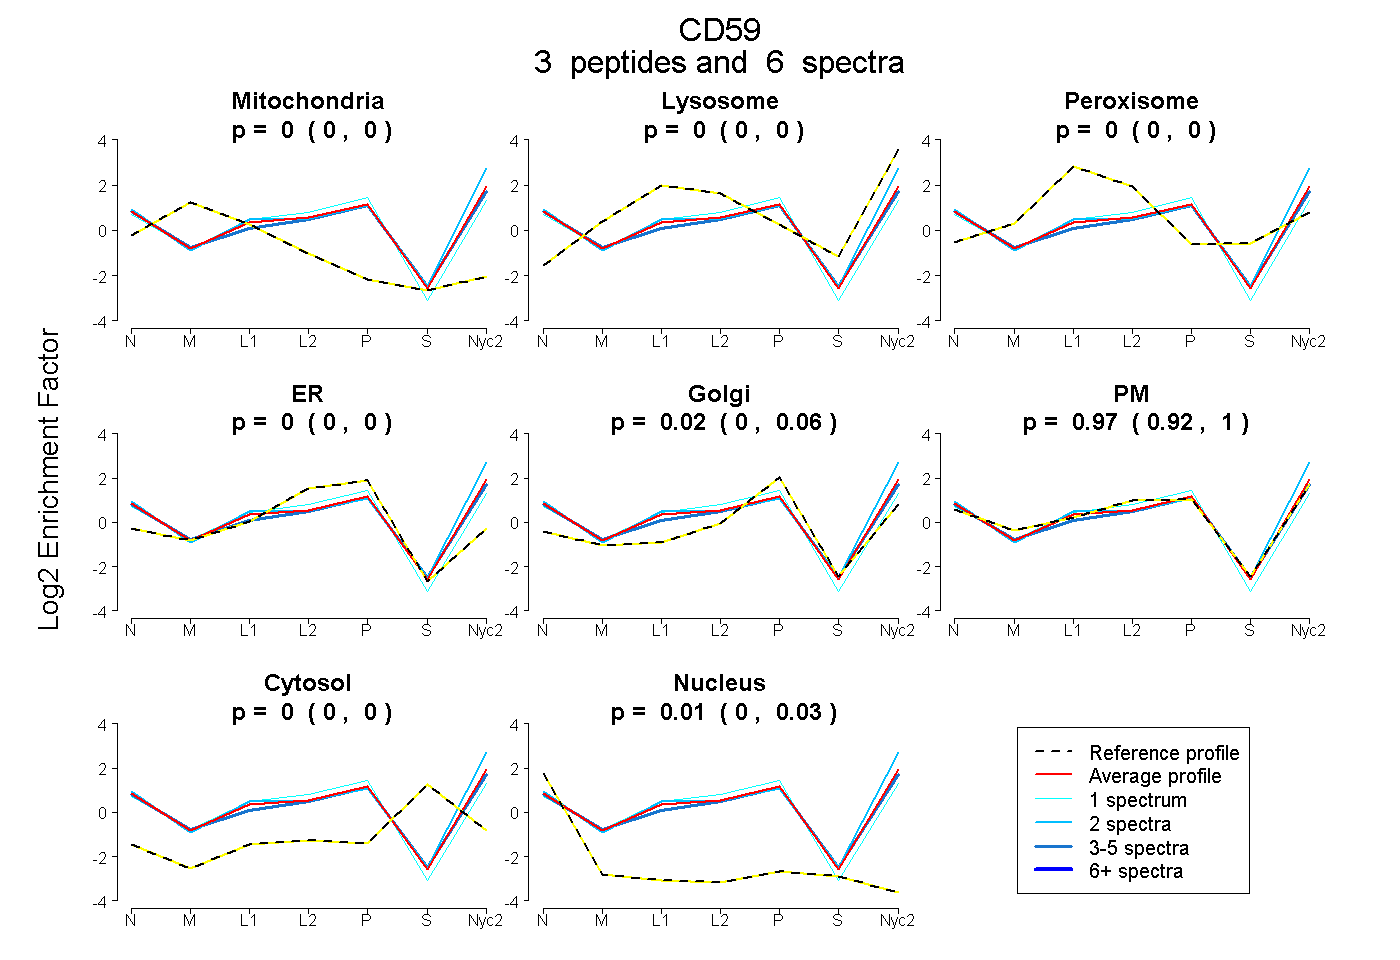
0.000 | 0.000
0.000 | 0.000
0.000 | 0.000
0.000 | 0.000
0.000 | 0.062
0.915 | 1.000
0.000 | 0.000
0.000 | 0.032
1peptide
spectra
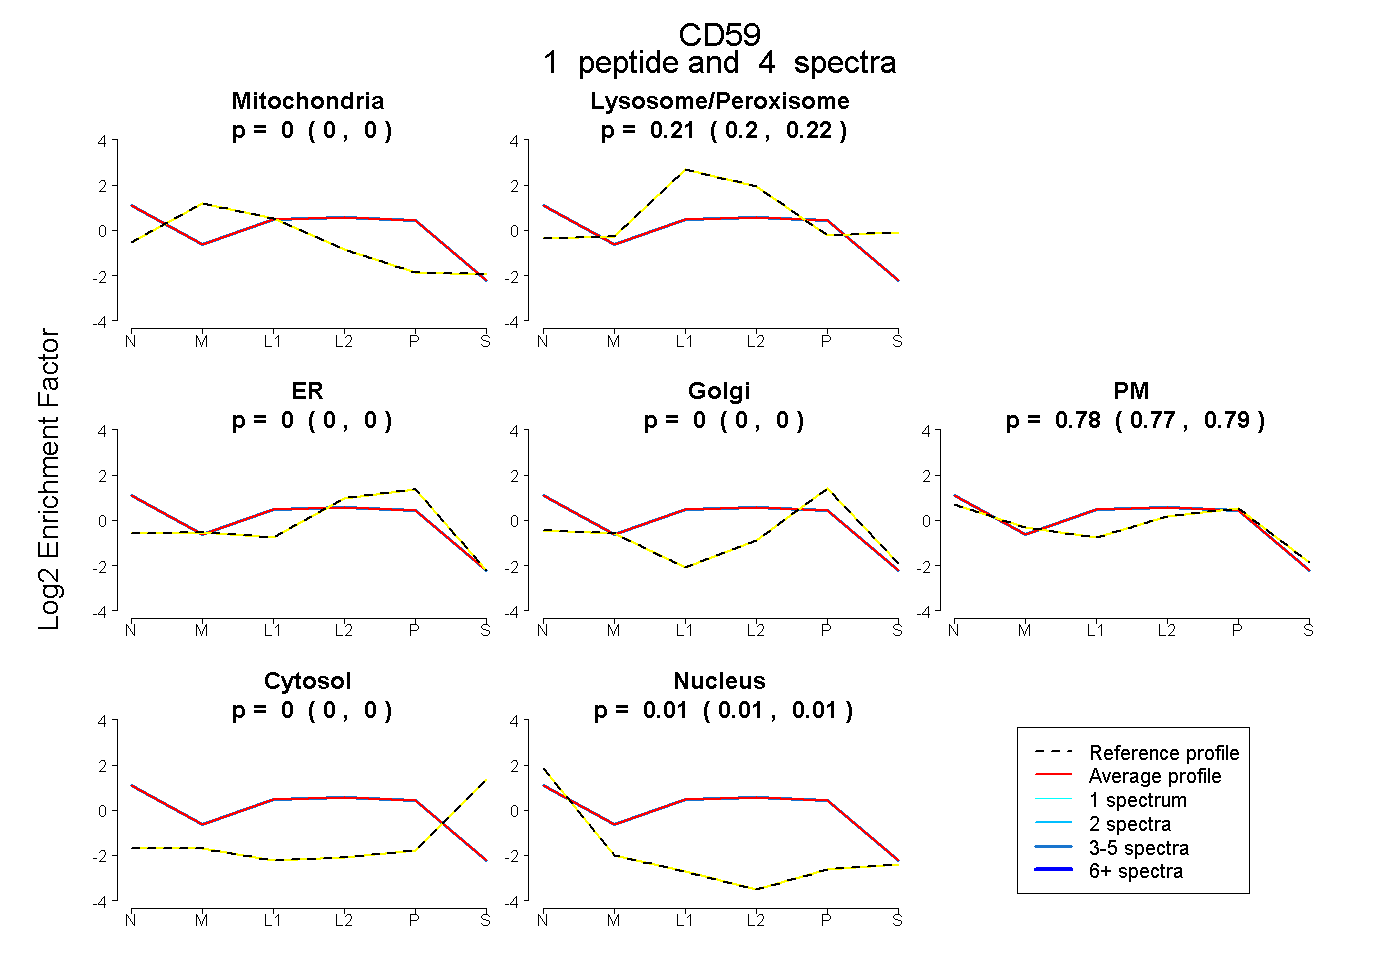
0.000 | 0.000
0.202 | 0.219
0.000 | 0.000
0.000 | 0.000
0.767 | 0.789
0.000 | 0.000
0.006 | 0.013
3peptides
spectra
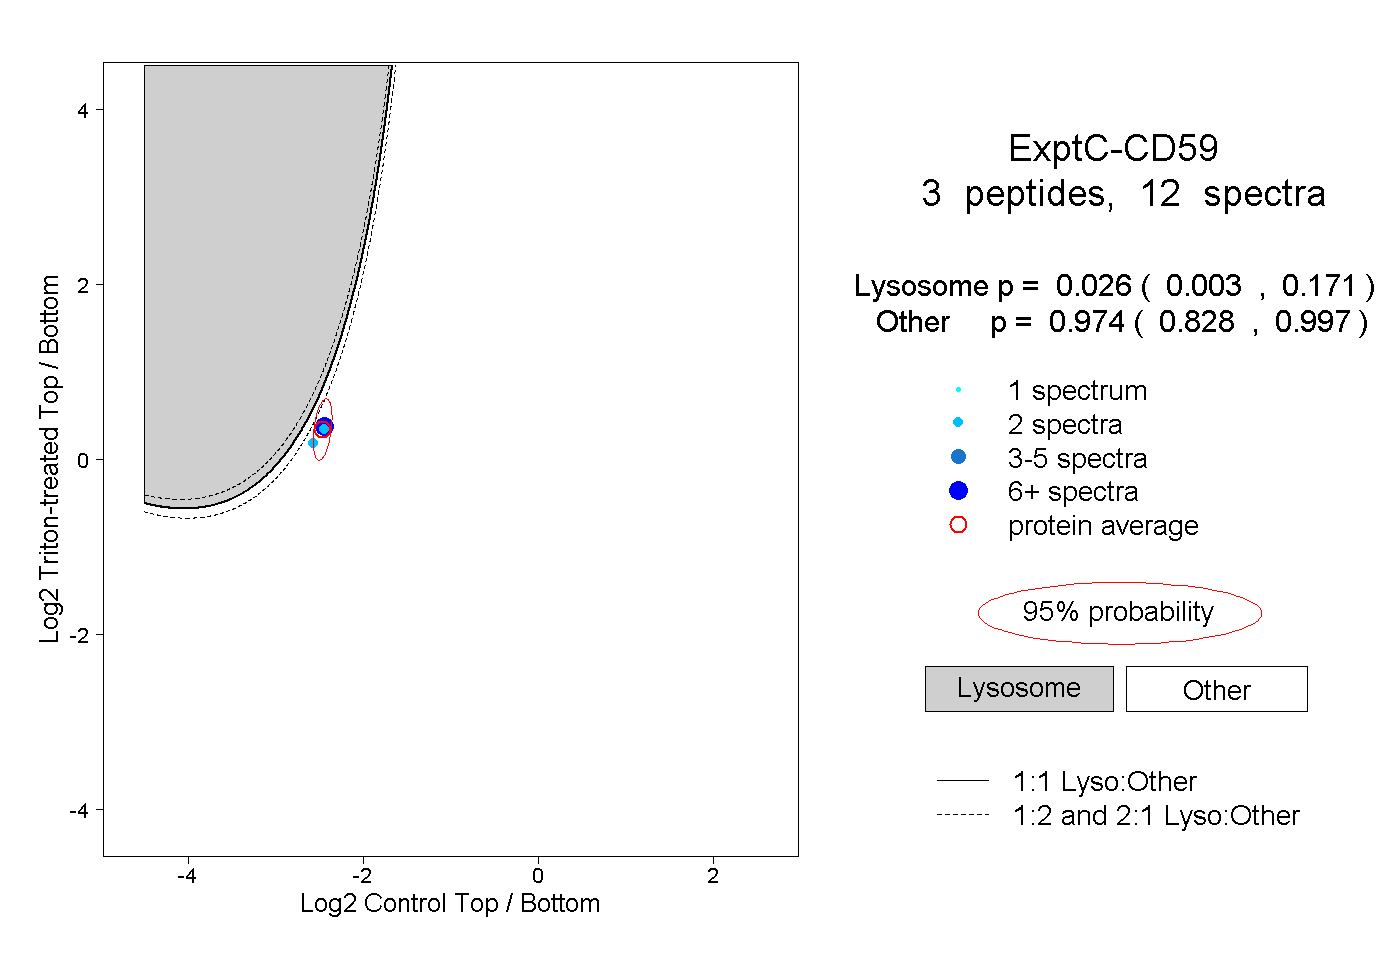
0.003 | 0.171
0.828 | 0.997
1peptide
spectrum
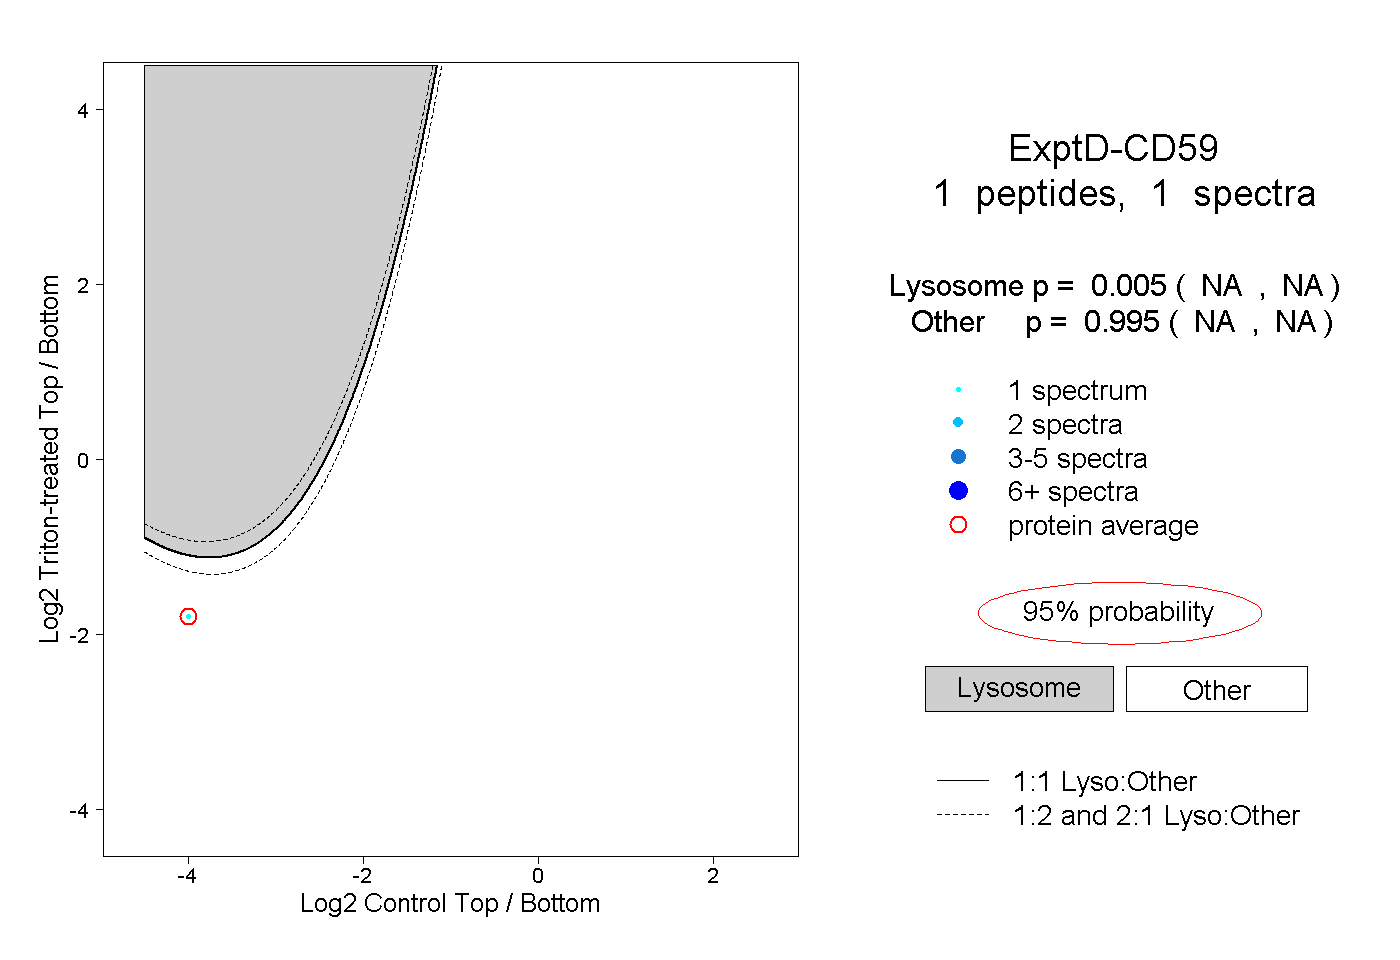
NA | NA
NA | NA