3
3peptides
spectra
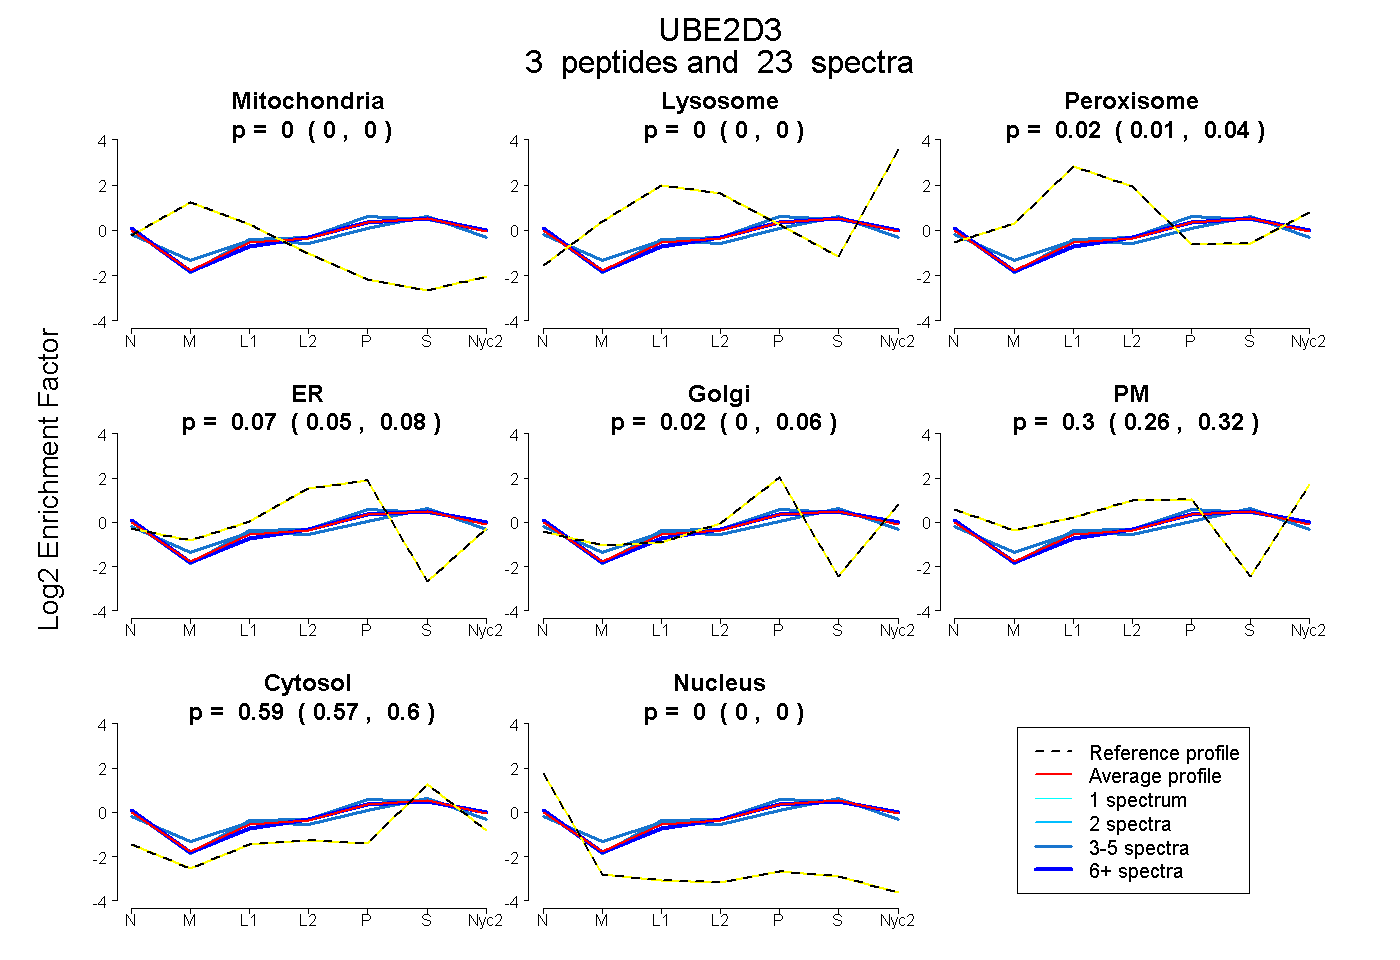
0.000 | 0.000
0.000 | 0.000
0.010 | 0.041
0.048 | 0.085
0.000 | 0.057
0.261 | 0.321
0.574 | 0.596
0.000 | 0.000
3peptides
spectra
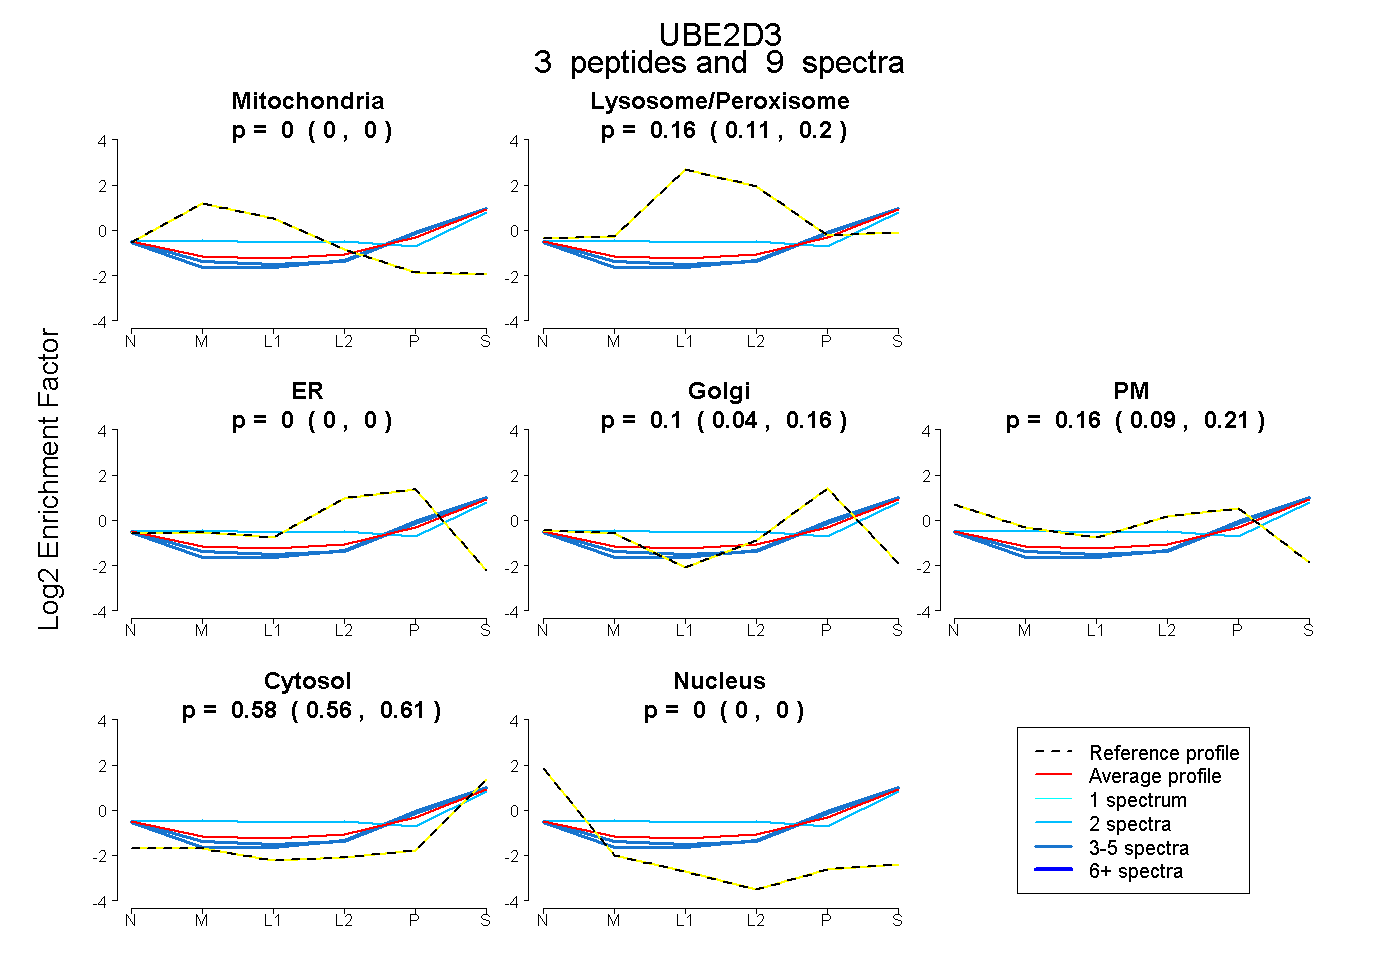
0.000 | 0.000
0.112 | 0.195
0.000 | 0.000
0.039 | 0.157
0.094 | 0.212
0.556 | 0.608
0.000 | 0.000