 3
3peptides
spectra
0.000 | 0.000
0.000 | 0.000
0.010 | 0.041
0.048 | 0.085
0.000 | 0.057
0.261 | 0.321
0.574 | 0.596
0.000 | 0.000
| Plot | Mito | Lyso | Perox | ER | Golgi | PM | Cytosol | Nucleus | |||||
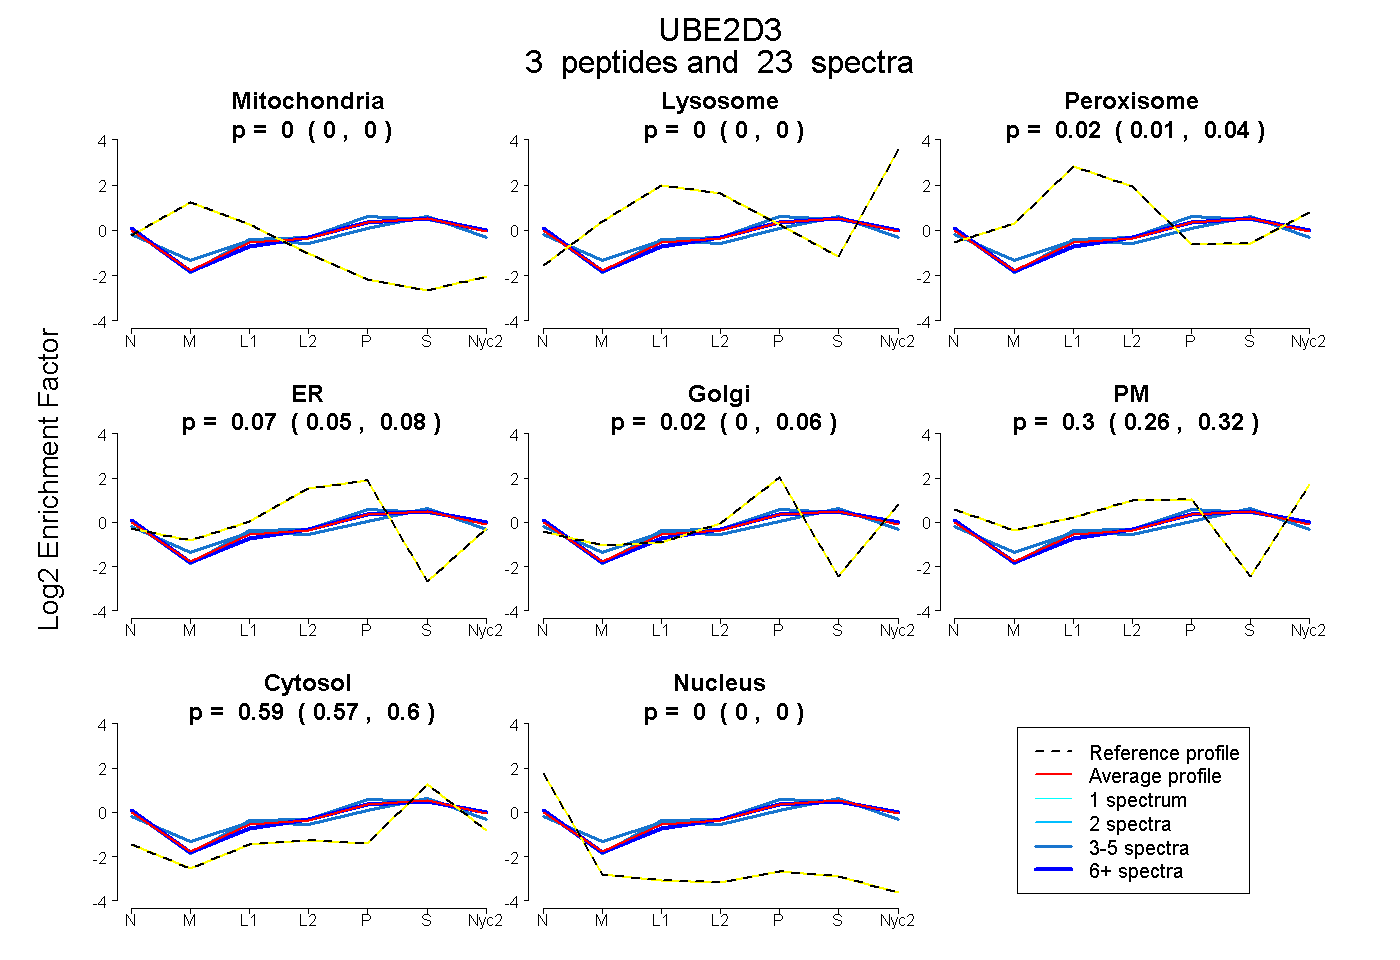
| Expt A |
3 peptides |
23 spectra |
|
0.000 0.000 | 0.000 |
0.000 0.000 | 0.000 |
0.025 0.010 | 0.041 |
0.070 0.048 | 0.085 |
0.022 0.000 | 0.057 |
0.297 0.261 | 0.321 |
0.587 0.574 | 0.596 |
0.000 0.000 | 0.000 |
| 3 spectra, SQWSPALTISK | 0.000 | 0.000 | 0.146 | 0.000 | 0.151 | 0.119 | 0.583 | 0.000 | ||
| 4 spectra, ELSDLAR | 0.000 | 0.000 | 0.059 | 0.056 | 0.121 | 0.228 | 0.537 | 0.000 | ||
| 16 spectra, VAFTTR | 0.000 | 0.000 | 0.000 | 0.057 | 0.016 | 0.338 | 0.590 | 0.000 |
| Plot | Mito | Lyso or Perox | ER | Golgi | PM | Cytosol | Nucleus | ||||||
| Expt B |
3 peptides |
9 spectra |
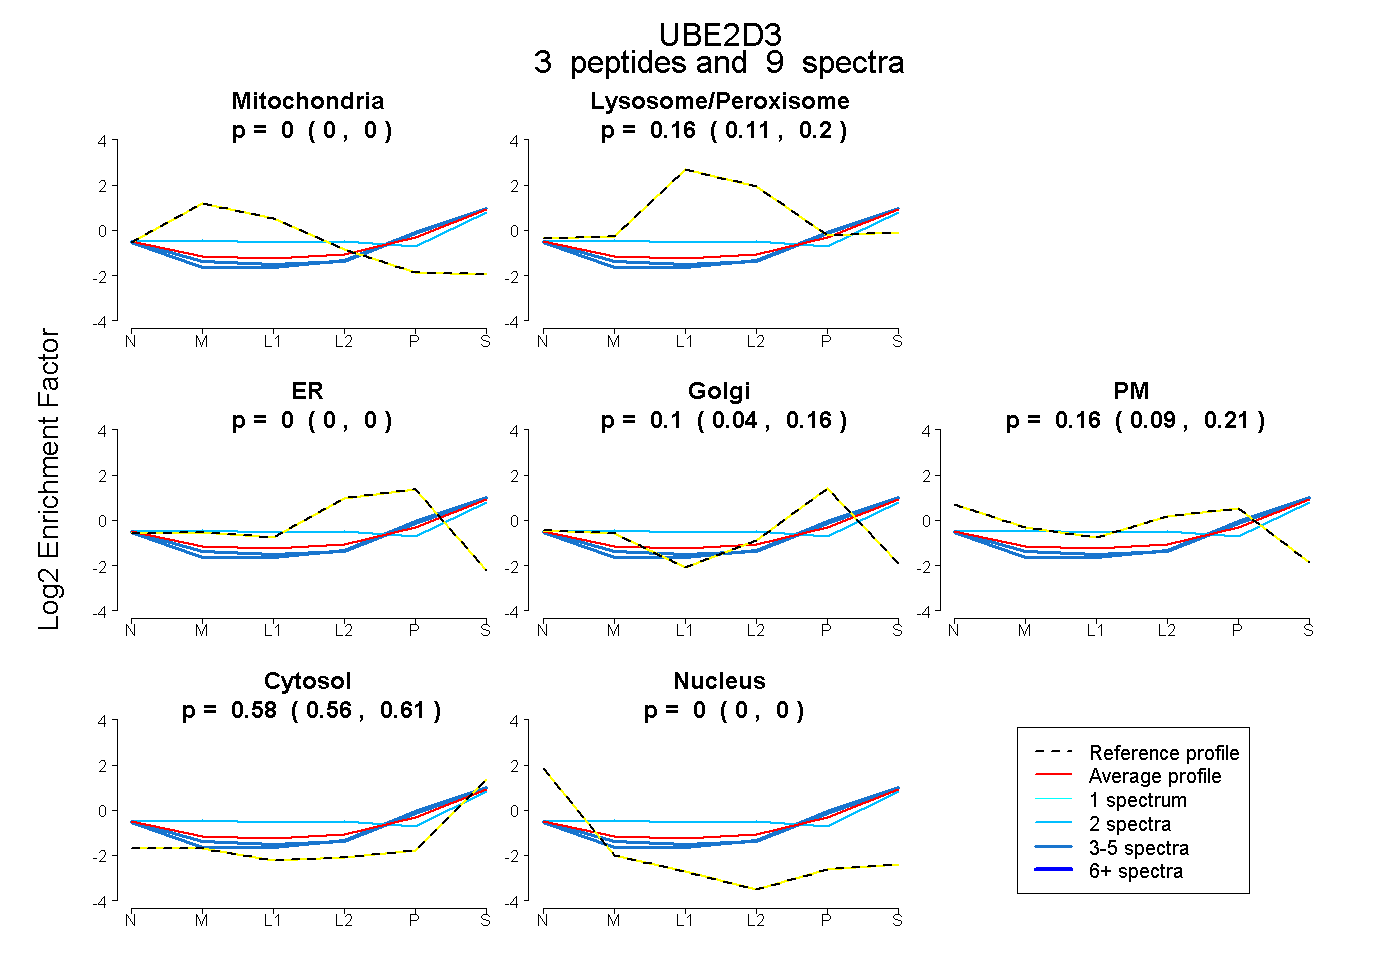 |
0.000 0.000 | 0.000 |
0.157 0.112 | 0.195 |
0.000 0.000 | 0.000 |
0.102 0.039 | 0.157 |
0.157 0.094 | 0.212 |
0.584 0.556 | 0.608 |
0.000 0.000 | 0.000 |
|||
| Plot | Lyso | Other | |||||||||||
| Expt C |
3 peptides |
16 spectra |
 |
0.000 0.000 | 0.000 |
1.000 1.000 | 1.000 |
||||||||
| Plot | Lyso | Other | |||||||||||
| Expt D |
3 peptides |
8 spectra |
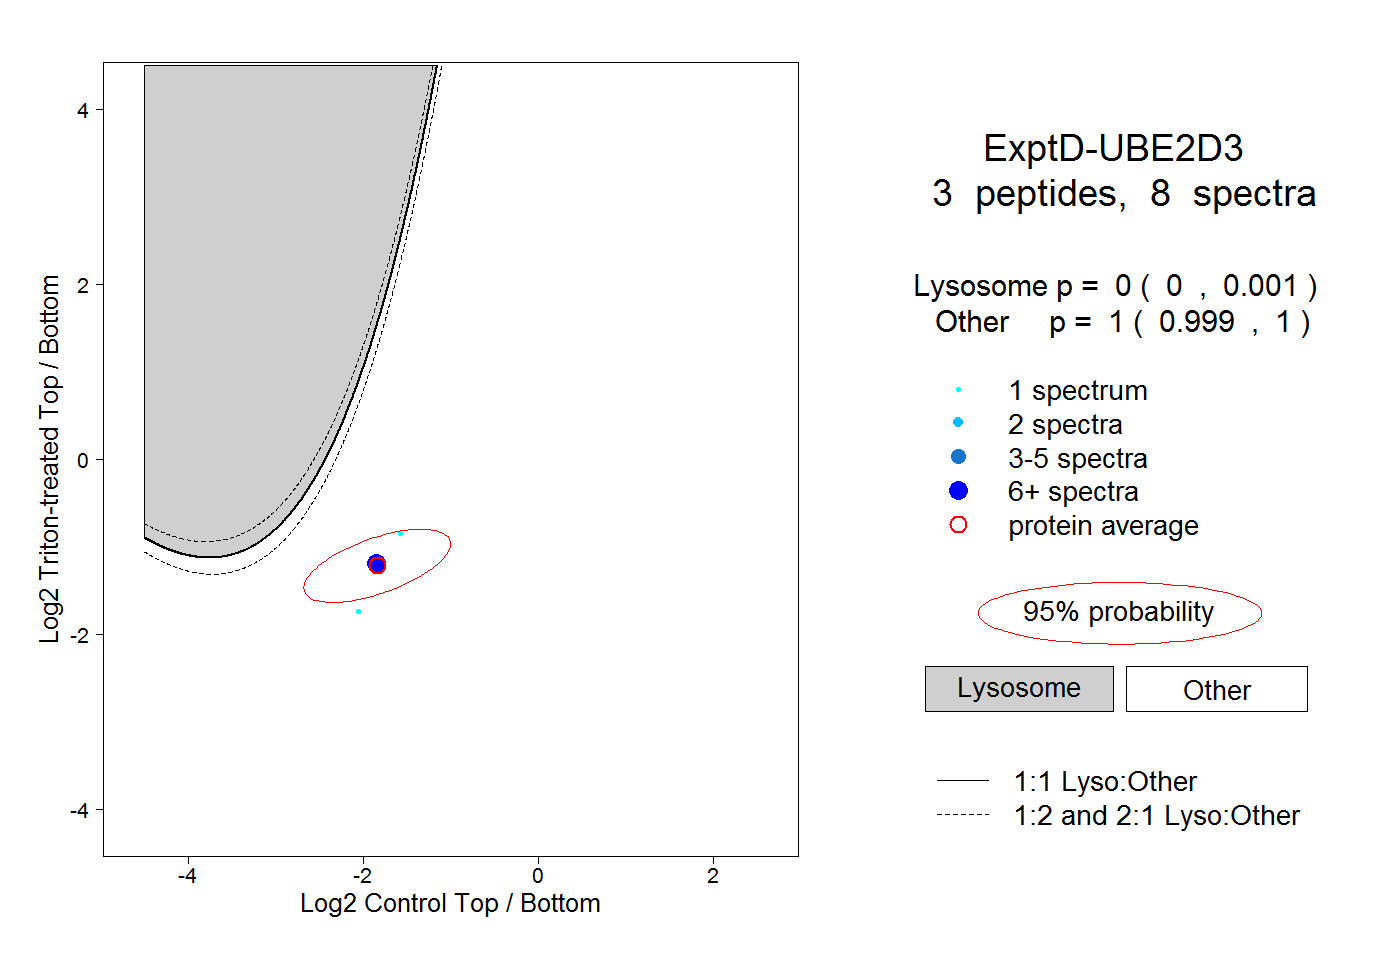 |
0.000 0.000 | 0.001 |
1.000 0.999 | 1.000 |