 6
6peptides
spectra
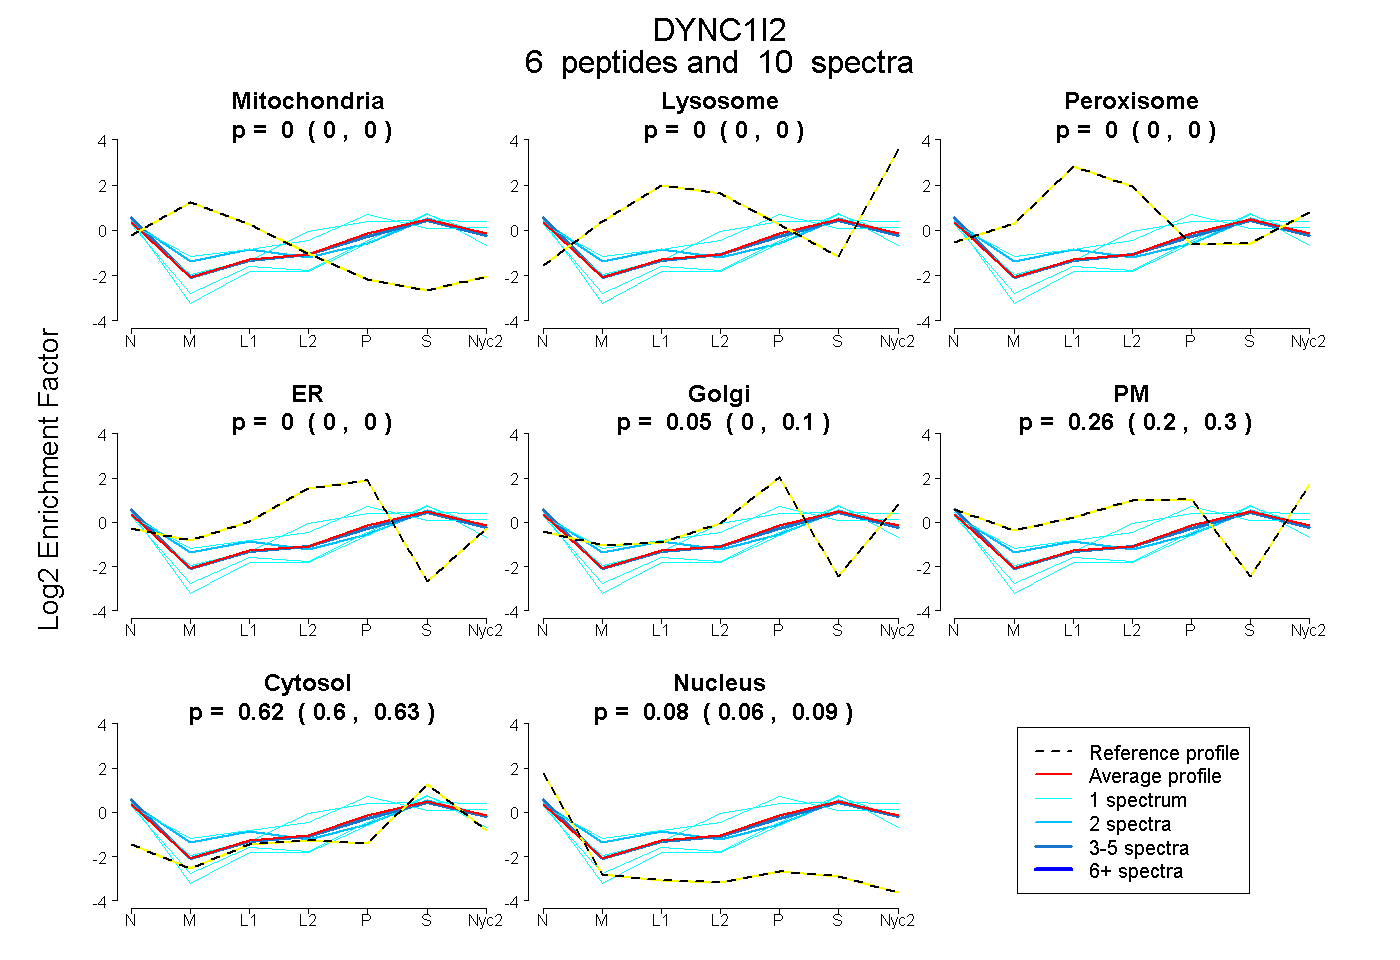
0.000 | 0.000
0.000 | 0.000
0.000 | 0.000
0.000 | 0.000
0.000 | 0.098
0.202 | 0.298
0.602 | 0.633
0.062 | 0.086
| Plot | Mito | Lyso | Perox | ER | Golgi | PM | Cytosol | Nucleus | |||||
| Expt A |
6 peptides |
10 spectra |
|
0.000 0.000 | 0.000 |
0.000 0.000 | 0.000 |
0.000 0.000 | 0.000 |
0.000 0.000 | 0.000 |
0.050 0.000 | 0.098 |
0.256 0.202 | 0.298 |
0.619 0.602 | 0.633 |
0.075 0.062 | 0.086 |
| 4 spectra, QFFDER | 0.000 | 0.000 | 0.000 | 0.000 | 0.000 | 0.293 | 0.594 | 0.113 | ||
| 1 spectrum, QQILHSEEFLSFFDHSTR | 0.000 | 0.000 | 0.000 | 0.000 | 0.200 | 0.329 | 0.471 | 0.000 | ||
| 1 spectrum, EIVTYTK | 0.000 | 0.000 | 0.000 | 0.000 | 0.139 | 0.013 | 0.704 | 0.145 | ||
| 1 spectrum, SVSTPSEAGSQDSGDGAVGSR | 0.000 | 0.000 | 0.000 | 0.000 | 0.089 | 0.351 | 0.560 | 0.000 | ||
| 1 spectrum, ETQTPVTAQPK | 0.000 | 0.000 | 0.000 | 0.000 | 0.102 | 0.043 | 0.703 | 0.151 | ||
| 2 spectra, APPHELTEEEK | 0.000 | 0.000 | 0.033 | 0.000 | 0.000 | 0.285 | 0.596 | 0.085 |
| Plot | Mito | Lyso or Perox | ER | Golgi | PM | Cytosol | Nucleus | ||||||
| Expt B |
1 peptide |
2 spectra |
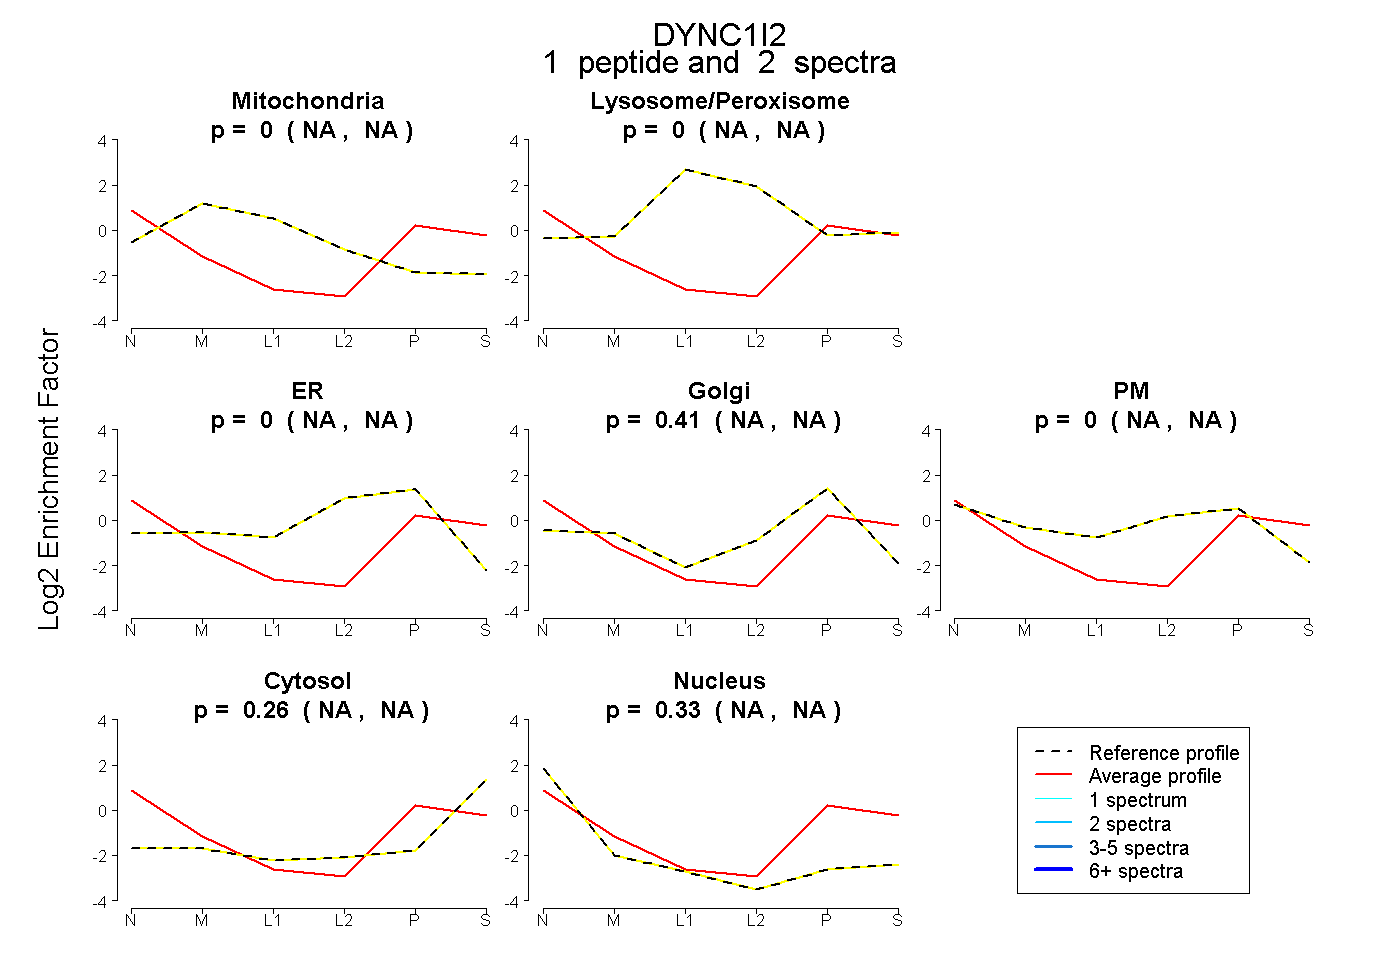 |
0.000 NA | NA |
0.000 NA | NA |
0.000 NA | NA |
0.412 NA | NA |
0.000 NA | NA |
0.260 NA | NA |
0.328 NA | NA |
|||
| Plot | Lyso | Other | |||||||||||
| Expt C |
6 peptides |
21 spectra |
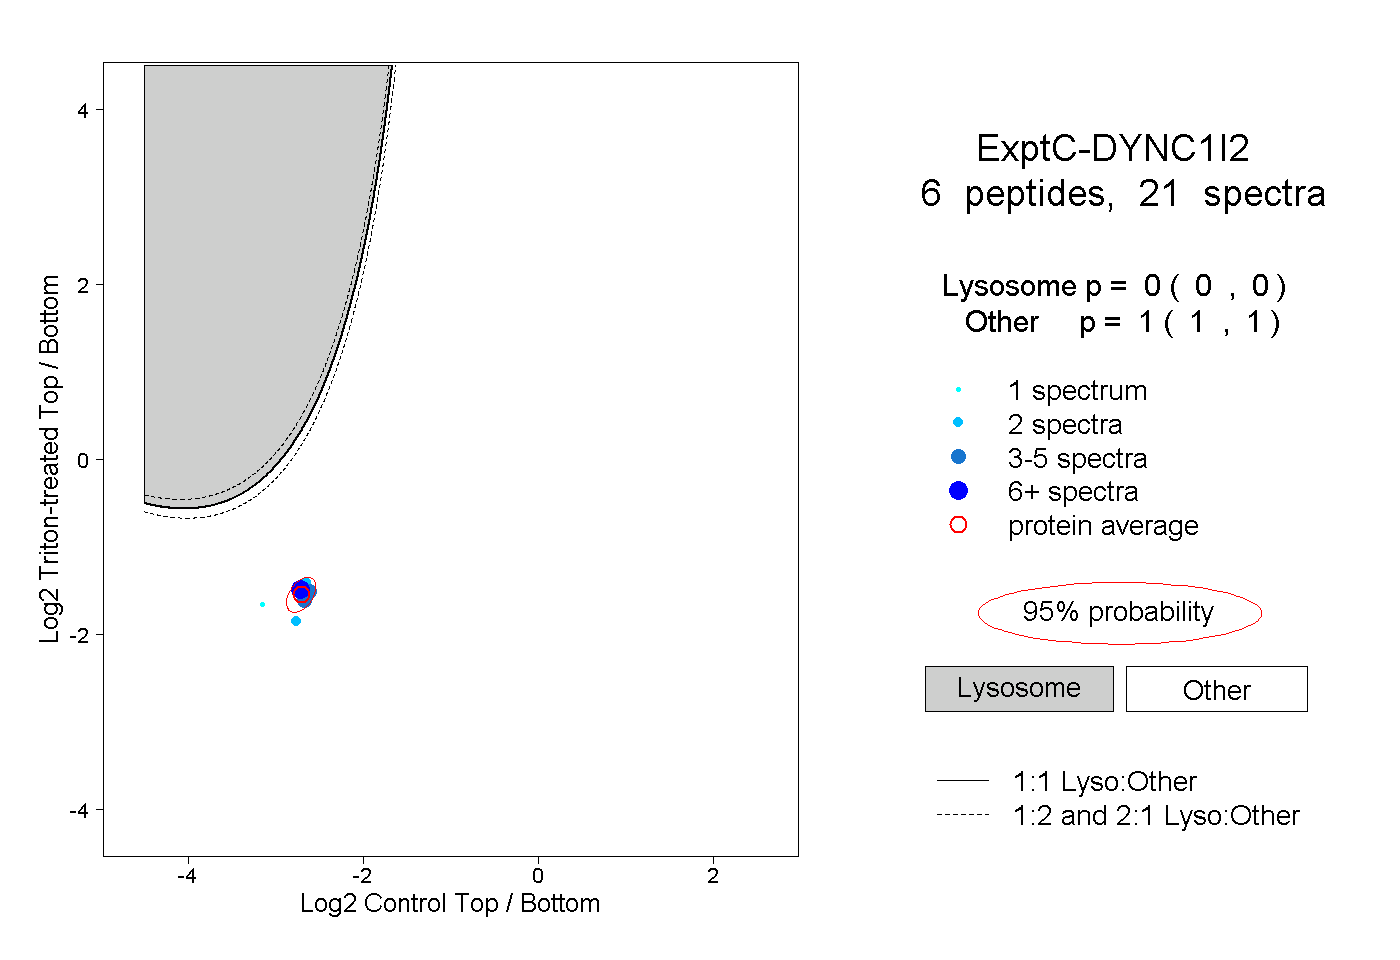 |
0.000 0.000 | 0.000 |
1.000 1.000 | 1.000 |