SCARB1
[ENSRNOP00000060874]
Main page
| | | Plot |
Mito |
Lyso |
|
Perox |
ER |
Golgi |
PM |
Cytosol |
Nucleus |
|
| Expt A |
 13
13
peptides |
48
spectra |
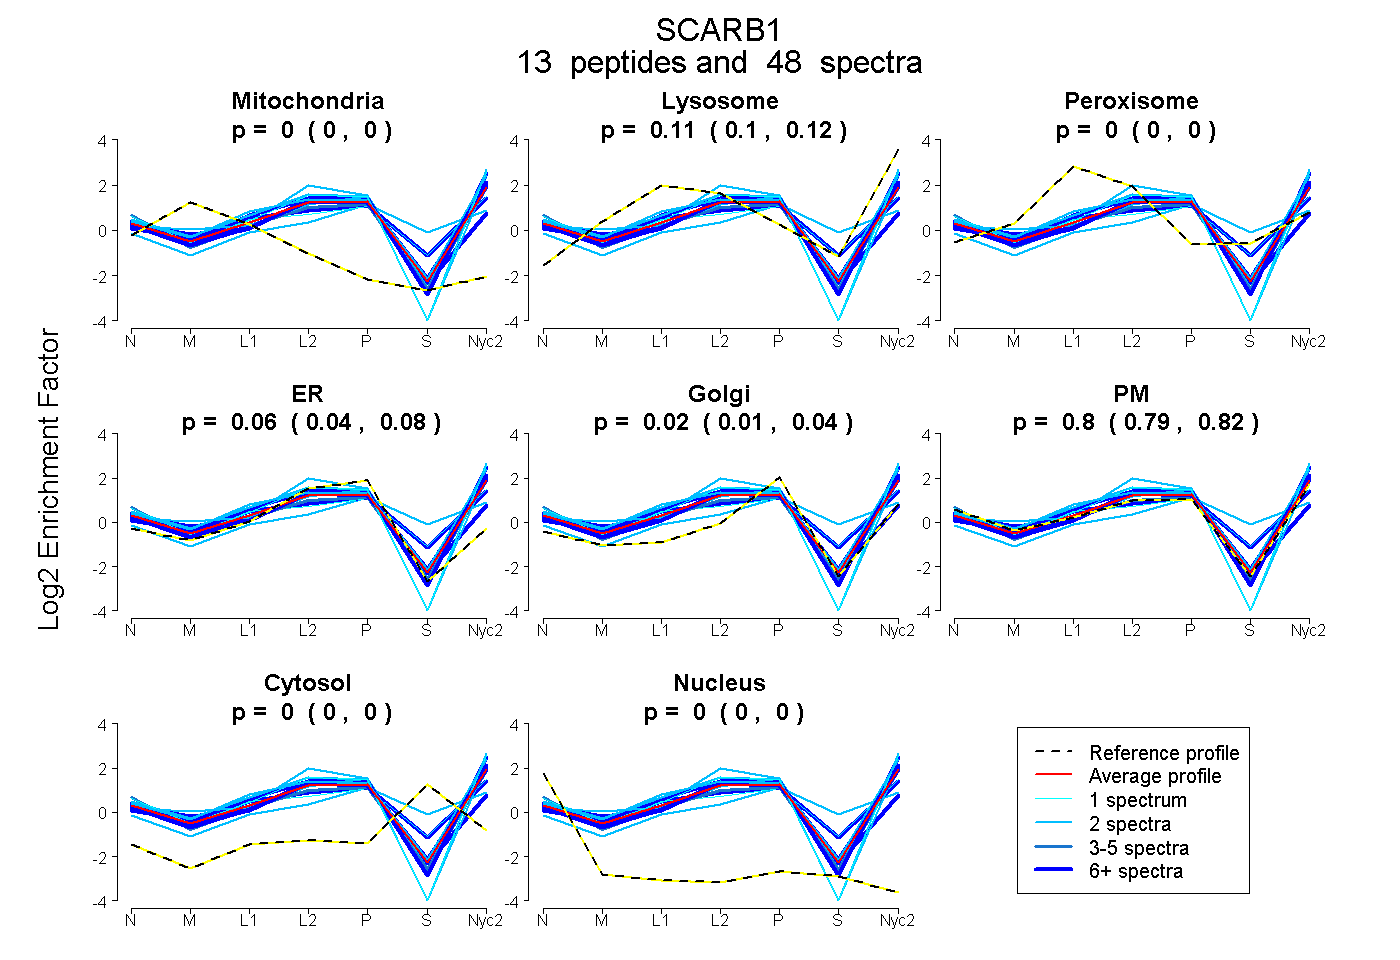 |
0.000
0.000 | 0.000 |
0.109
0.100 | 0.117 |
|
0.000
0.000 | 0.000 |
0.063
0.043 | 0.078 |
0.025
0.011 | 0.036 |
0.803
0.787 | 0.818 |
0.000
0.000 | 0.000 |
0.000
0.000 | 0.000 |
|
| | | Plot |
Mito |
|
Lyso or Perox |
|
ER |
Golgi |
PM |
Cytosol |
Nucleus |
|
| Expt B |
3
peptides |
7
spectra |
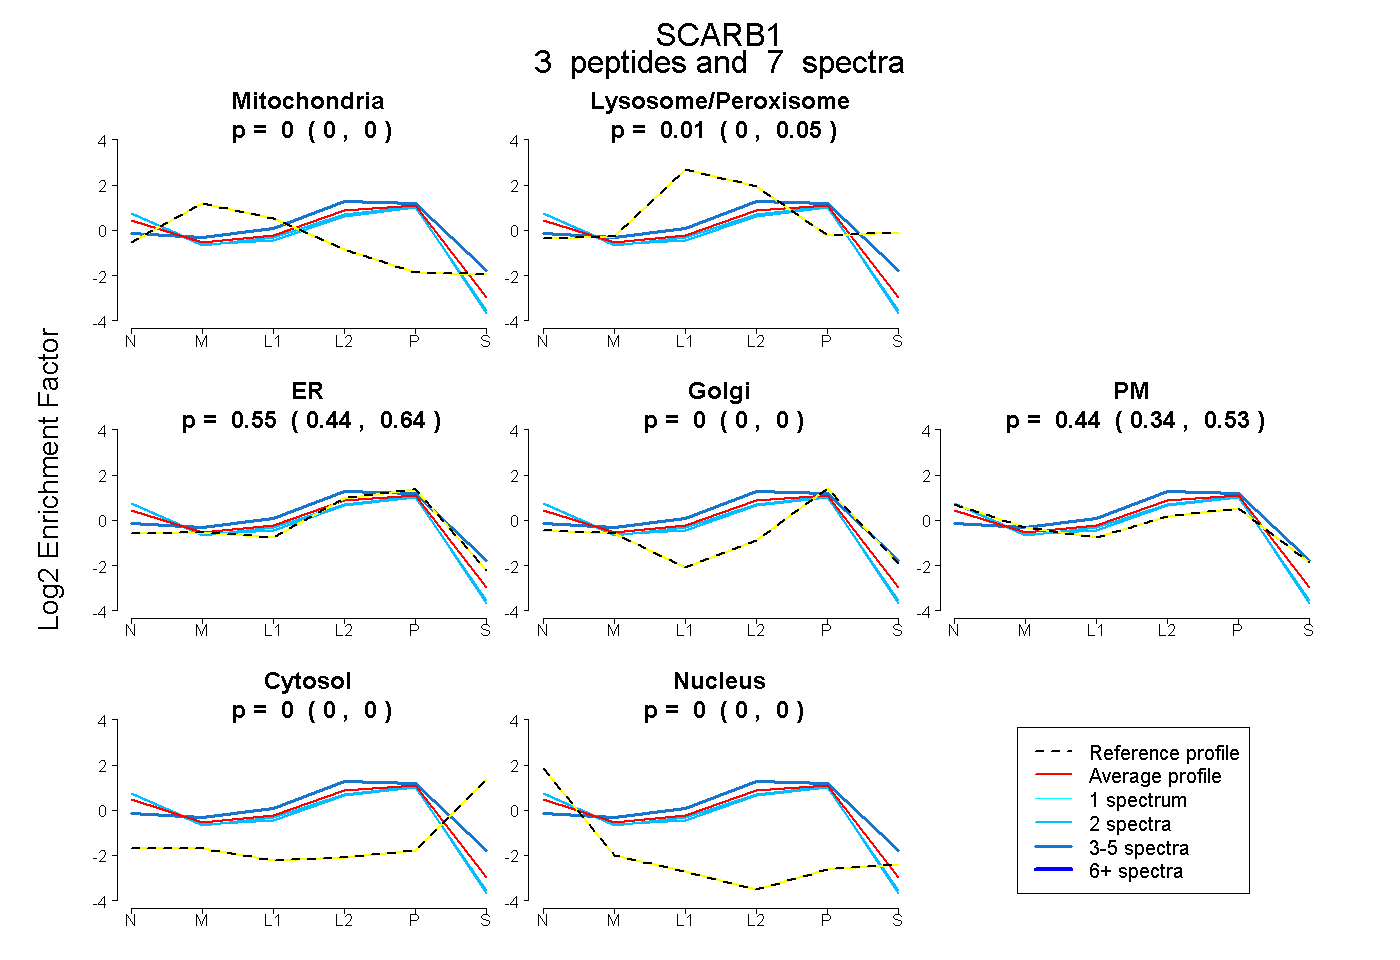 |
0.000
0.000 | 0.000 |
|
0.007
0.000 | 0.050 |
|
0.555
0.438 | 0.638 |
0.000
0.000 | 0.000 |
0.439
0.335 | 0.527 |
0.000
0.000 | 0.000 |
0.000
0.000 | 0.000 |
|
| 2 spectra, LTYQESR |
0.000 |
|
0.000 |
|
0.458 |
0.000 |
0.526 |
0.000 |
0.017 |
|
| 3 spectra, IHLVDK |
0.000 |
|
0.217 |
|
0.675 |
0.000 |
0.108 |
0.000 |
0.000 |
|
| 2 spectra, VFEGIPTYR |
0.000 |
|
0.000 |
|
0.480 |
0.000 |
0.510 |
0.000 |
0.010 |
|
| | | Plot |
|
Lyso |
|
|
|
|
|
|
|
Other |
| Expt C |
11
peptides |
120
spectra |
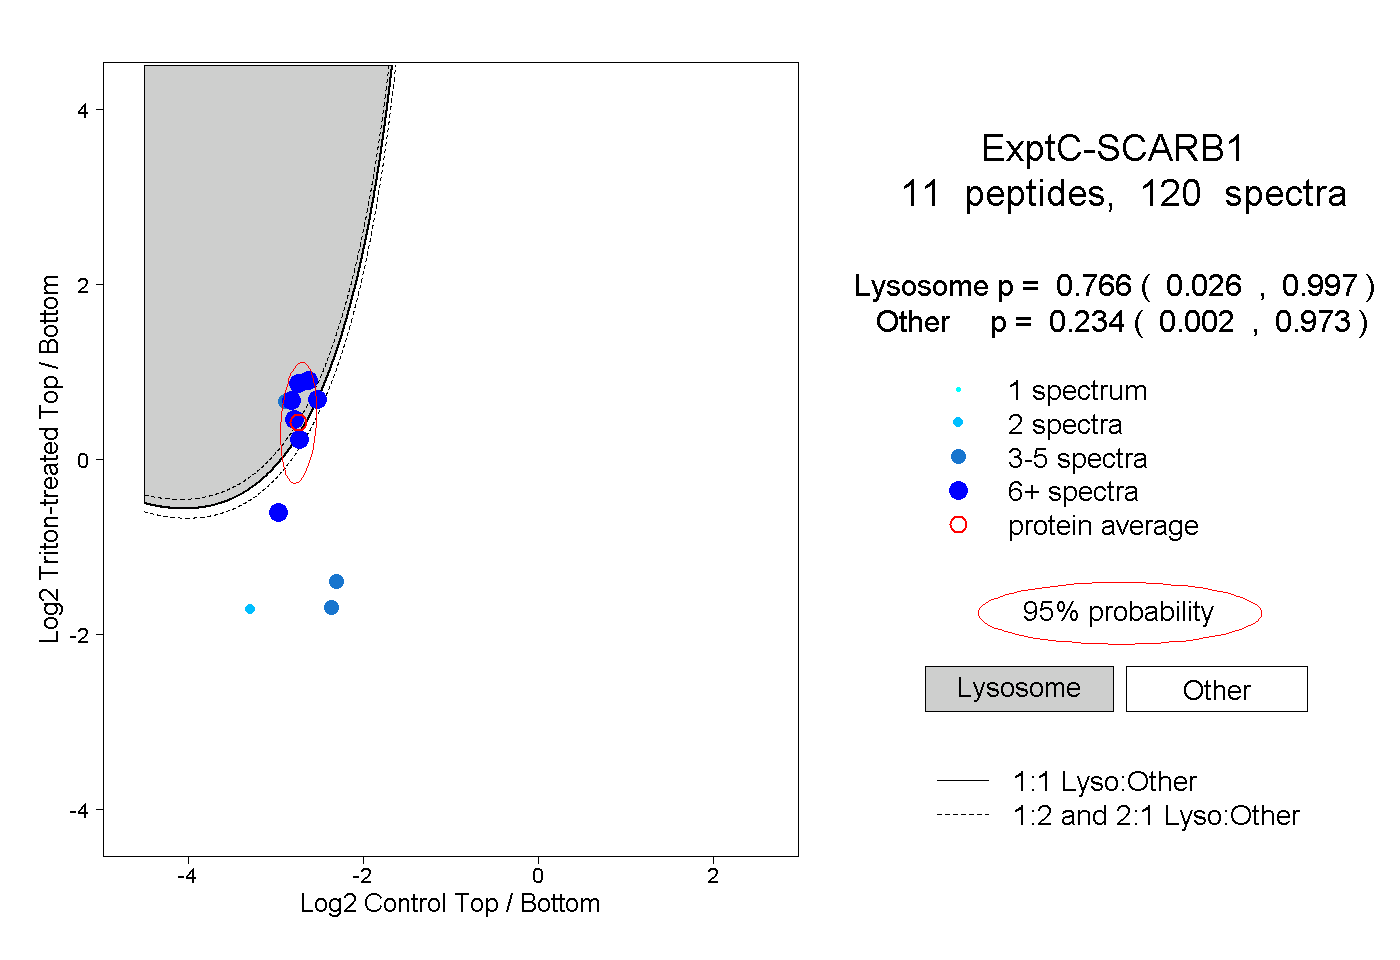 |
|
0.766
0.026 | 0.997 |
|
|
|
|
|
|
|
0.234
0.002 | 0.973 |
| | | Plot |
|
Lyso |
|
|
|
|
|
|
|
Other |
| Expt D |
4
peptides |
5
spectra |
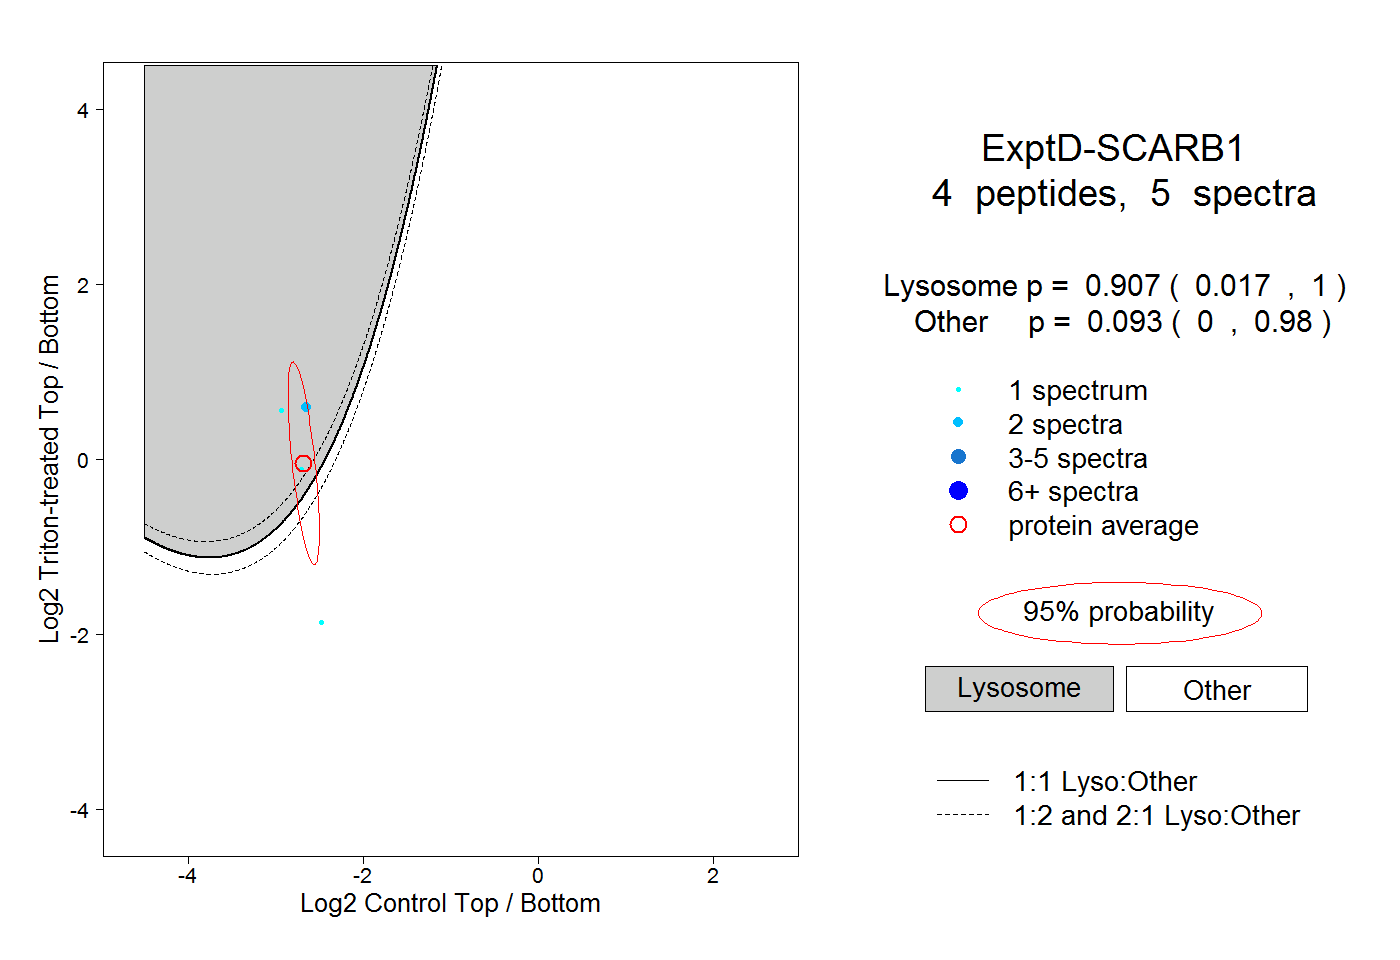 |
|
0.907
0.017 | 1.000 |
|
|
|
|
|
|
|
0.093
0.000 | 0.980 |