 4
4peptides
spectra
0.000 | 0.000
0.000 | 0.000
0.000 | 0.000
0.263 | 0.375
0.005 | 0.134
0.000 | 0.000
0.535 | 0.581
0.019 | 0.055
1peptide
spectrum
NA | NA
NA | NA
| Plot | Mito | Lyso | Perox | ER | Golgi | PM | Cytosol | Nucleus | |||||
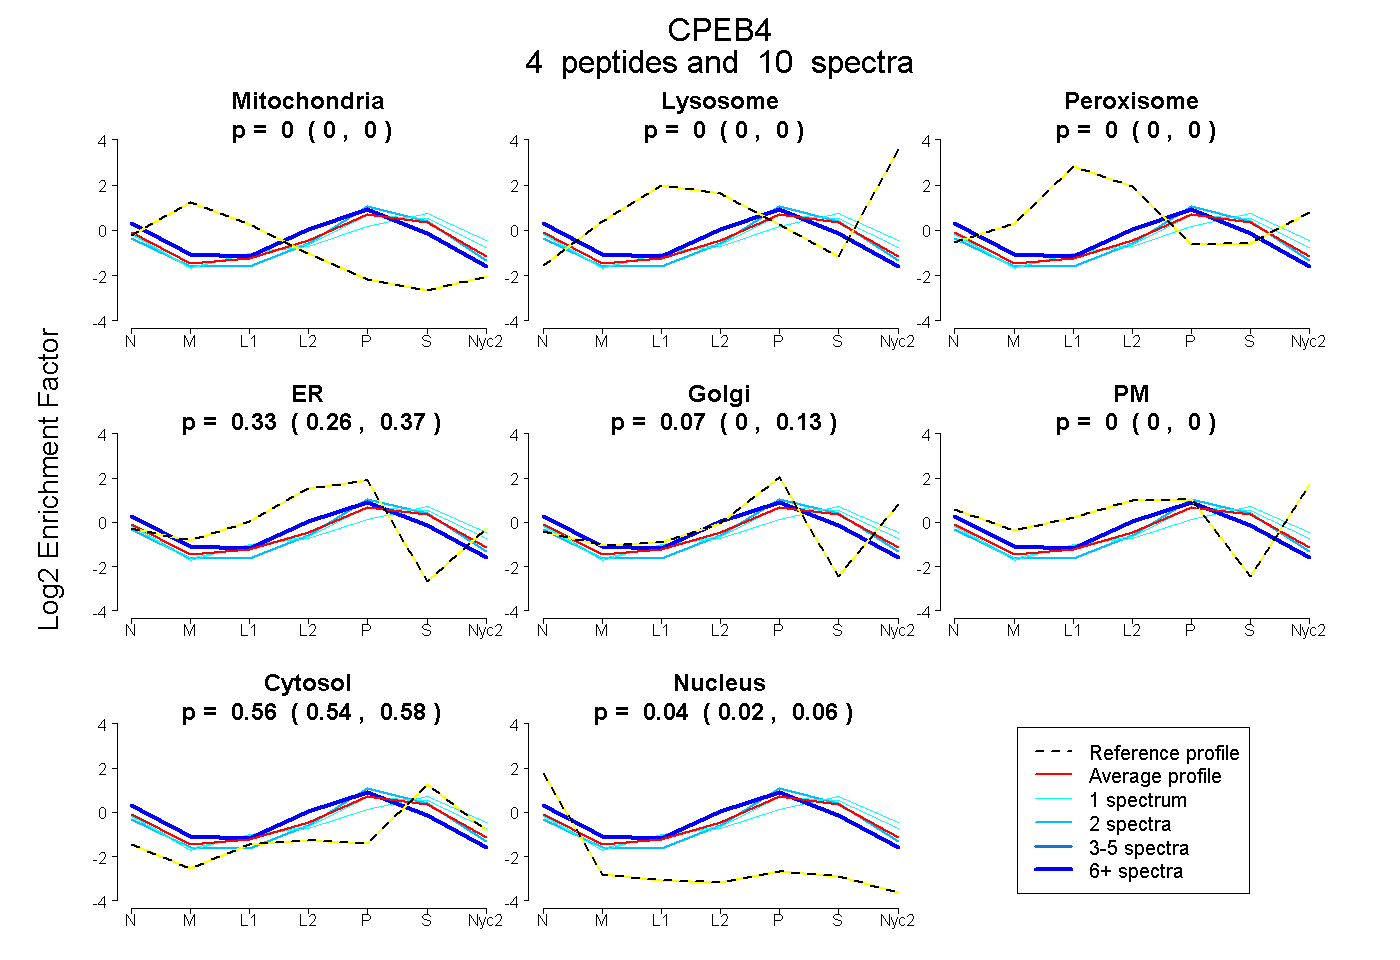
| Expt A |
4 peptides |
10 spectra |
|
0.000 0.000 | 0.000 |
0.000 0.000 | 0.000 |
0.000 0.000 | 0.000 |
0.327 0.263 | 0.375 |
0.074 0.005 | 0.134 |
0.000 0.000 | 0.000 |
0.561 0.535 | 0.581 |
0.039 0.019 | 0.055 |
||
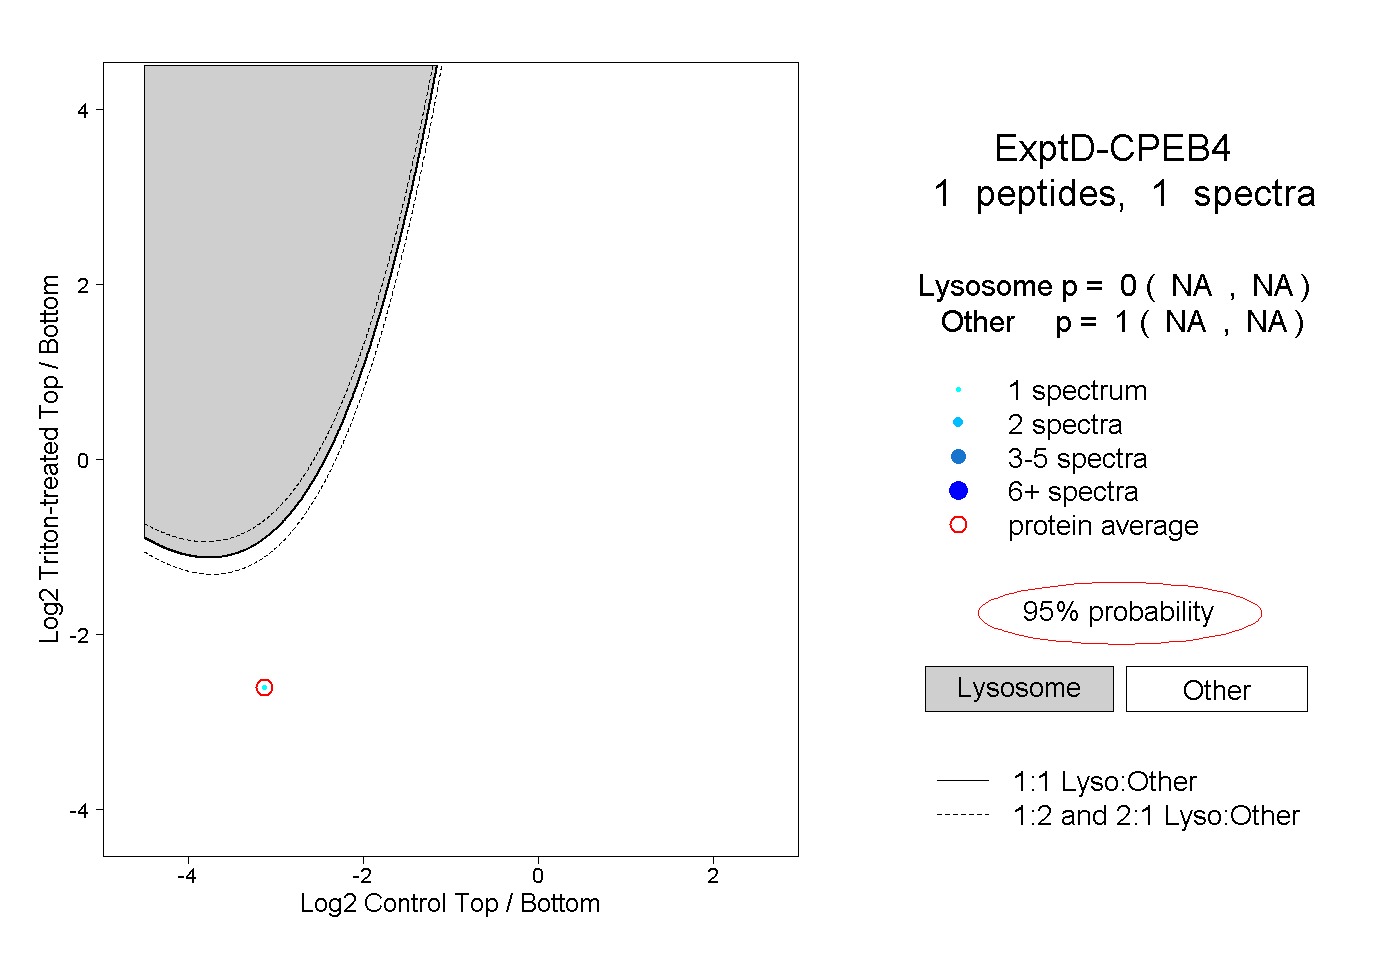
| Plot | Lyso | Other | |||||||||||
| Expt D |
1 peptide |
1 spectrum |
|
0.000 NA | NA |
1.000 NA | NA |