 3
3peptides
spectra
0.000 | 0.000
0.000 | 0.000
0.000 | 0.133
0.000 | 0.115
0.000 | 0.000
0.000 | 0.393
0.532 | 0.638
0.000 | 0.144
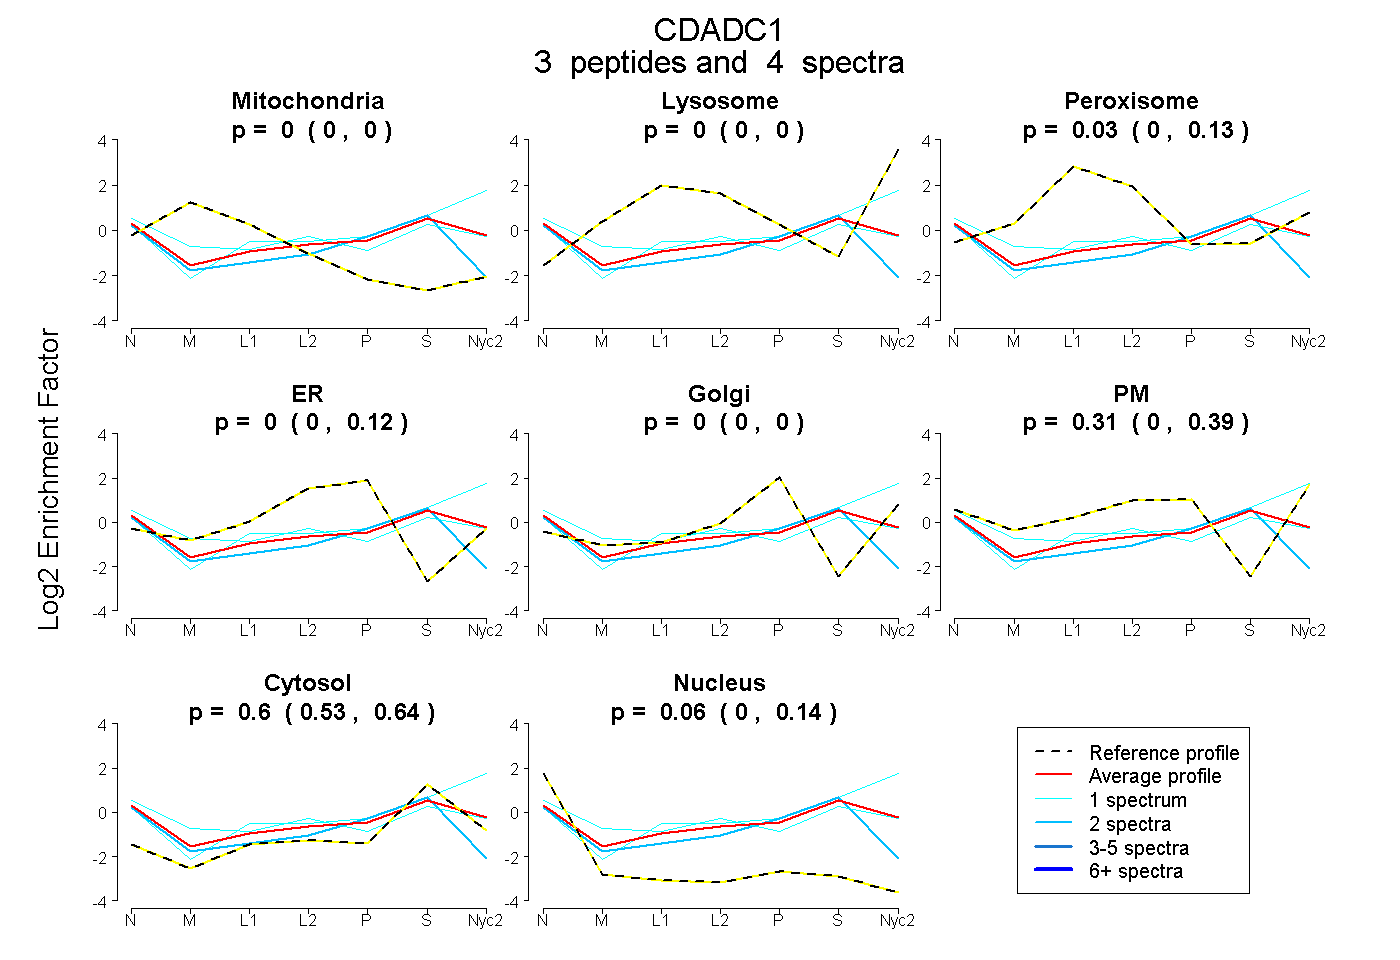
| Plot | Mito | Lyso | Perox | ER | Golgi | PM | Cytosol | Nucleus | |||||
| Expt A |
3 peptides |
4 spectra |
|
0.000 0.000 | 0.000 |
0.000 0.000 | 0.000 |
0.032 0.000 | 0.133 |
0.000 0.000 | 0.115 |
0.000 0.000 | 0.000 |
0.307 0.000 | 0.393 |
0.604 0.532 | 0.638 |
0.057 0.000 | 0.144 |
| 1 spectrum, SVGTQTGSMTGQIPR | 0.045 | 0.000 | 0.162 | 0.000 | 0.000 | 0.242 | 0.447 | 0.103 | ||
| 2 spectra, MIVNAGVNR | 0.000 | 0.000 | 0.000 | 0.195 | 0.000 | 0.000 | 0.618 | 0.187 | ||
| 1 spectrum, GPLGDNEDLAR | 0.000 | 0.154 | 0.000 | 0.000 | 0.000 | 0.292 | 0.555 | 0.000 |