 3
3peptides
spectra
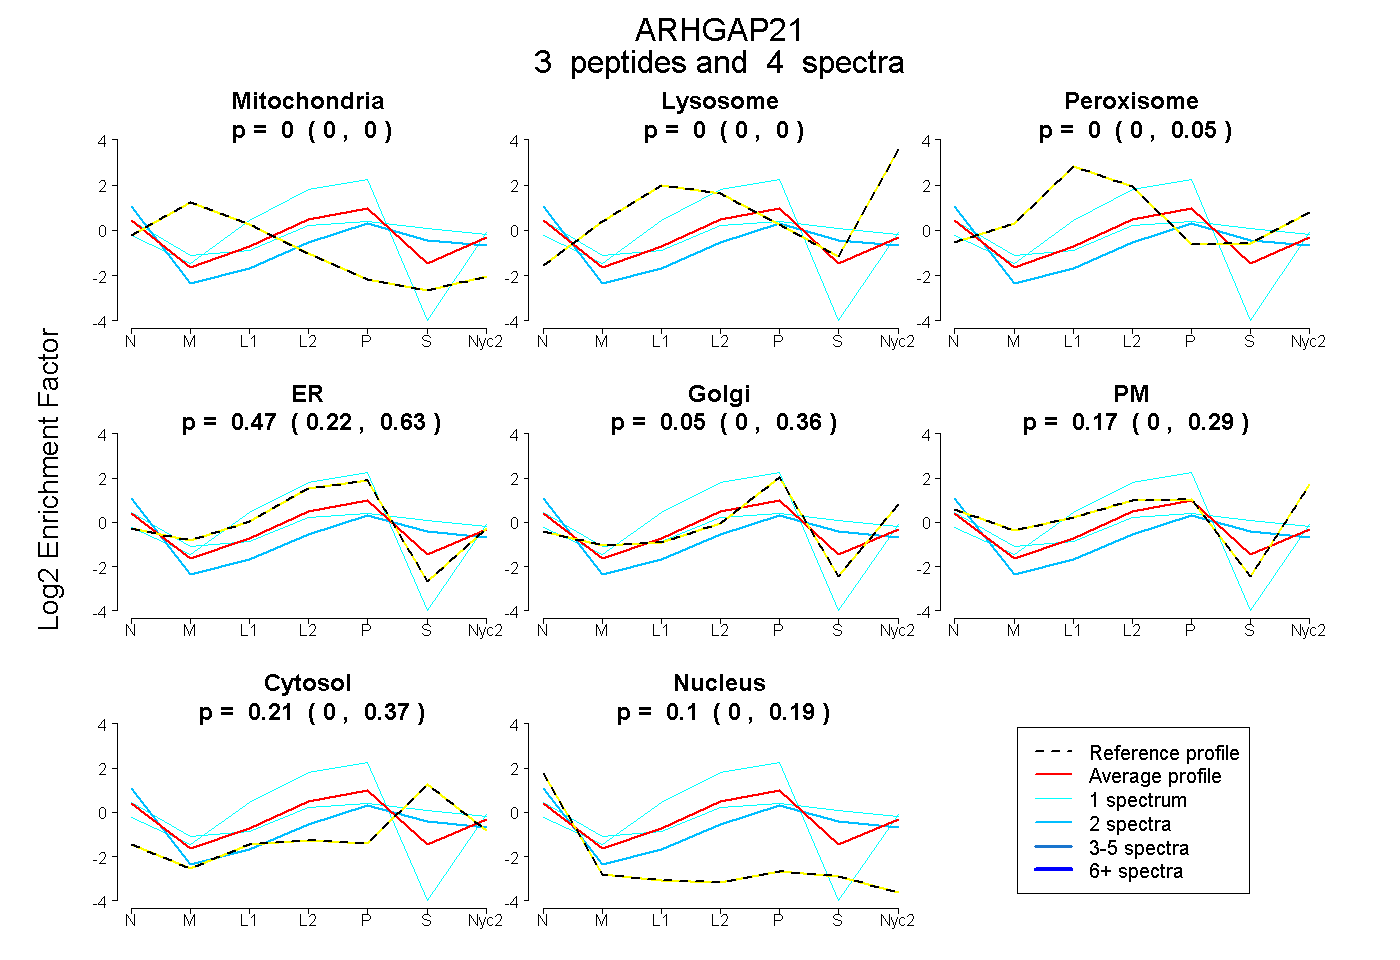
0.000 | 0.000
0.000 | 0.000
0.000 | 0.053
0.222 | 0.632
0.000 | 0.356
0.000 | 0.290
0.000 | 0.374
0.000 | 0.191
| Plot | Mito | Lyso | Perox | ER | Golgi | PM | Cytosol | Nucleus | |||||
| Expt A |
3 peptides |
4 spectra |
|
0.000 0.000 | 0.000 |
0.000 0.000 | 0.000 |
0.000 0.000 | 0.053 |
0.474 0.222 | 0.632 |
0.048 0.000 | 0.356 |
0.175 0.000 | 0.290 |
0.207 0.000 | 0.374 |
0.097 0.000 | 0.191 |
| 1 spectrum, LHIGCR | 0.000 | 0.000 | 0.000 | 0.160 | 0.000 | 0.359 | 0.474 | 0.008 | ||
| 1 spectrum, EVHIK | 0.000 | 0.000 | 0.000 | 1.000 | 0.000 | 0.000 | 0.000 | 0.000 | ||
| 2 spectra, TTPPPSAPTAR | 0.000 | 0.000 | 0.000 | 0.053 | 0.184 | 0.191 | 0.362 | 0.211 |
| Plot | Lyso | Other | |||||||||||
| Expt C |
1 peptide |
1 spectrum |
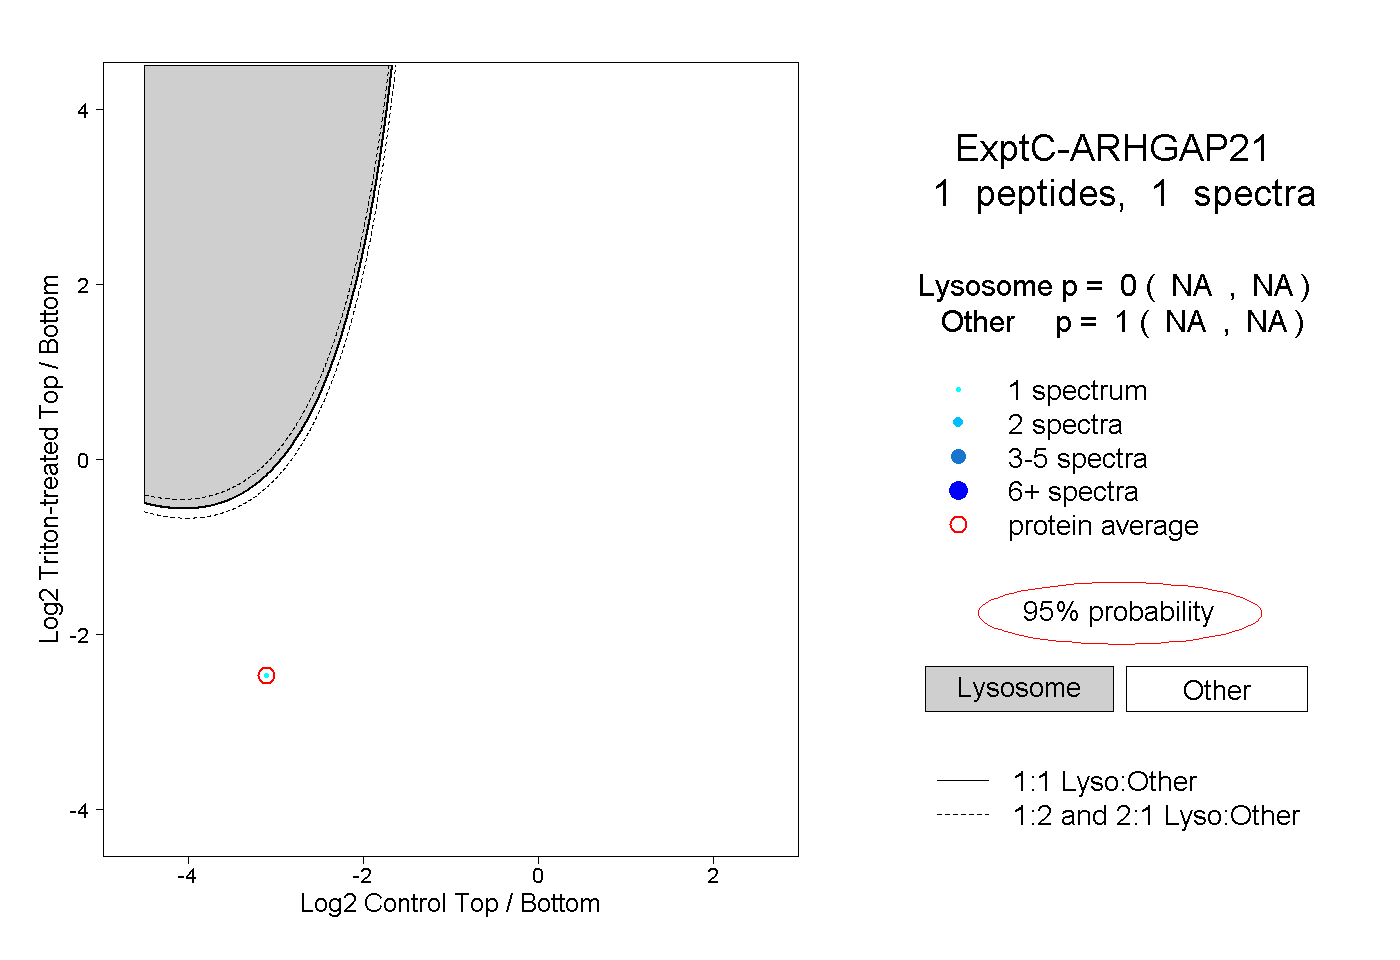 |
0.000 NA | NA |
1.000 NA | NA |