28
28peptides
spectra
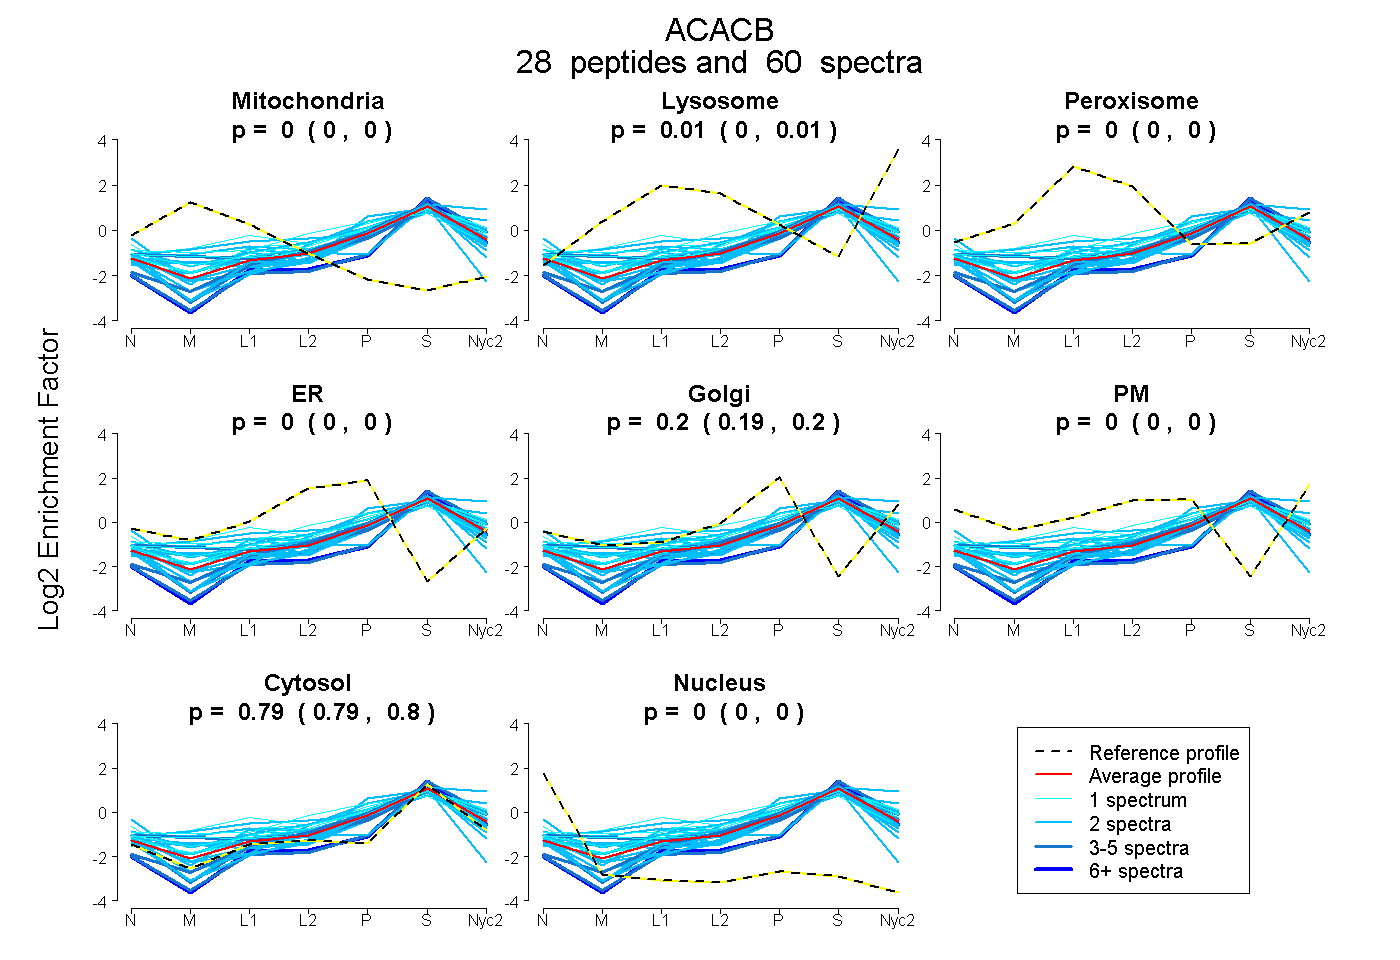
0.000 | 0.000
0.003 | 0.012
0.000 | 0.000
0.000 | 0.000
0.195 | 0.203
0.000 | 0.000
0.789 | 0.795
0.000 | 0.000
5peptides
spectra
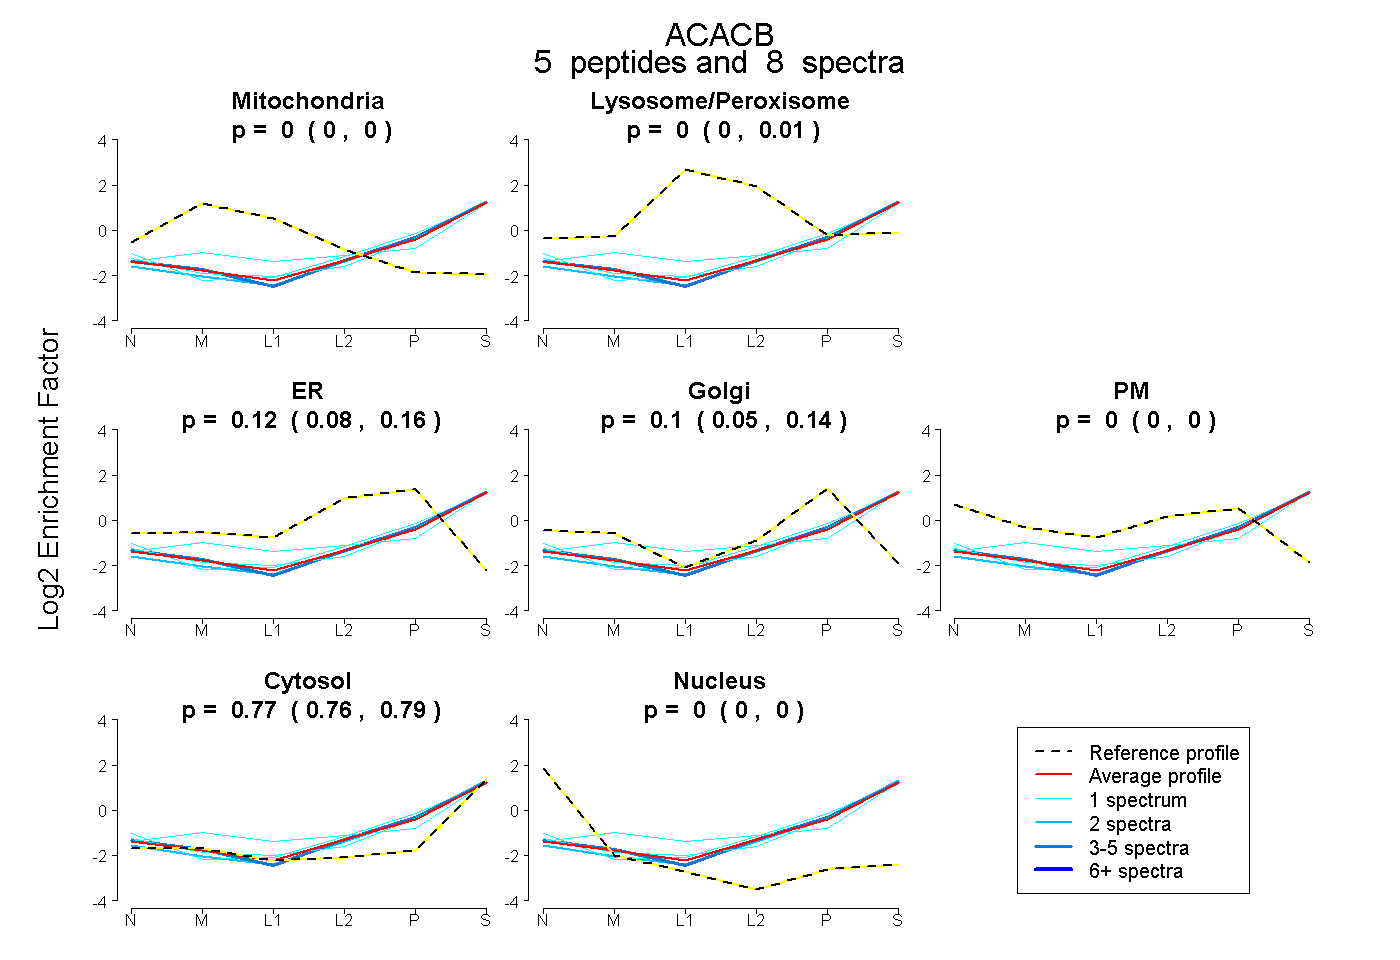
0.000 | 0.000
0.000 | 0.010
0.081 | 0.156
0.055 | 0.141
0.000 | 0.000
0.759 | 0.785
0.000 | 0.000
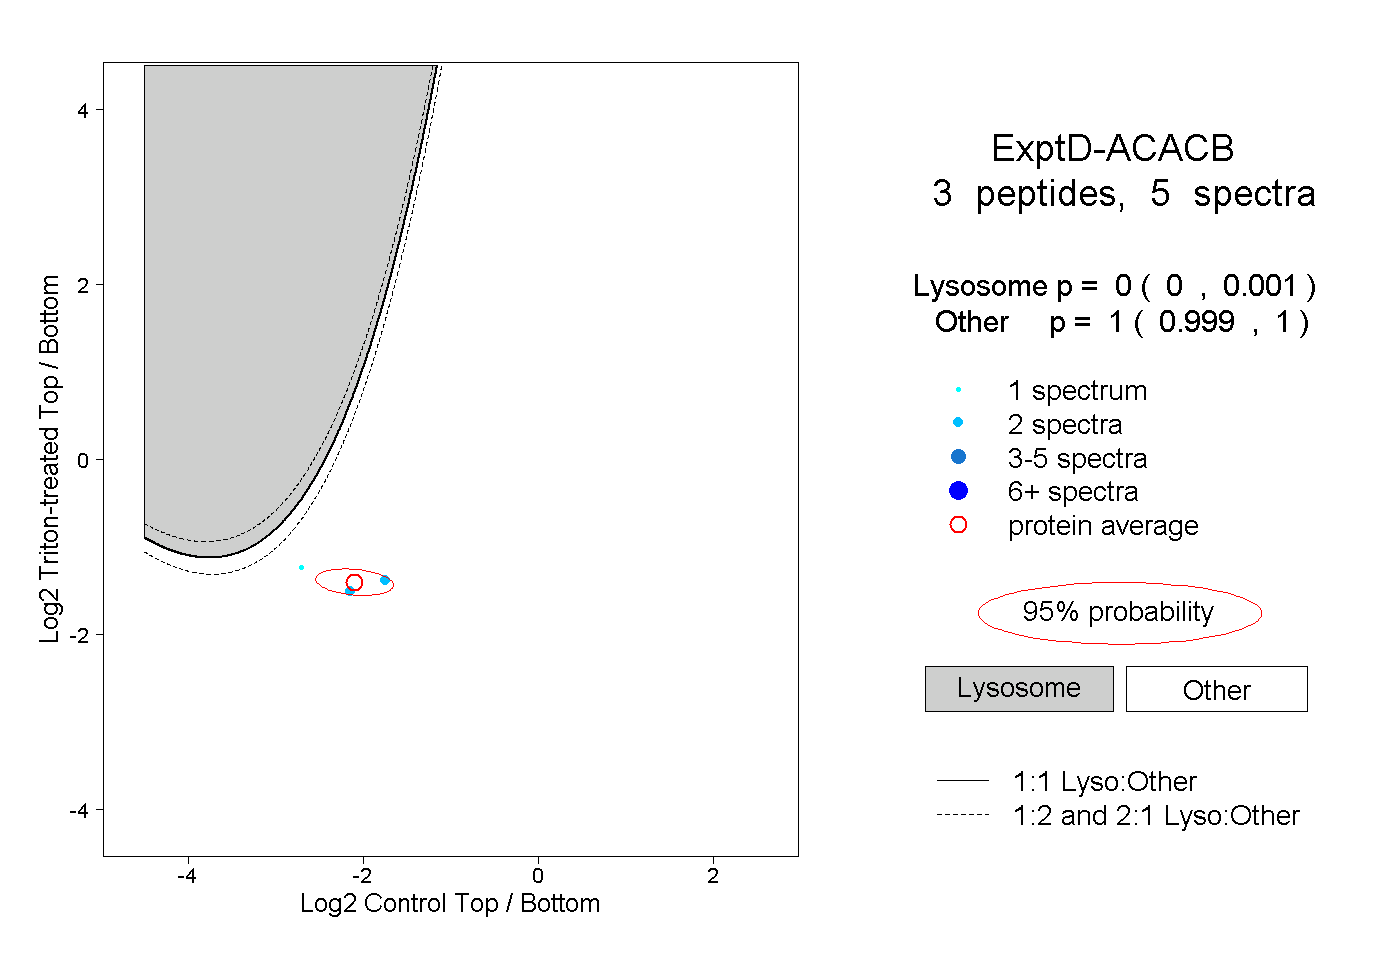
17peptides
spectra
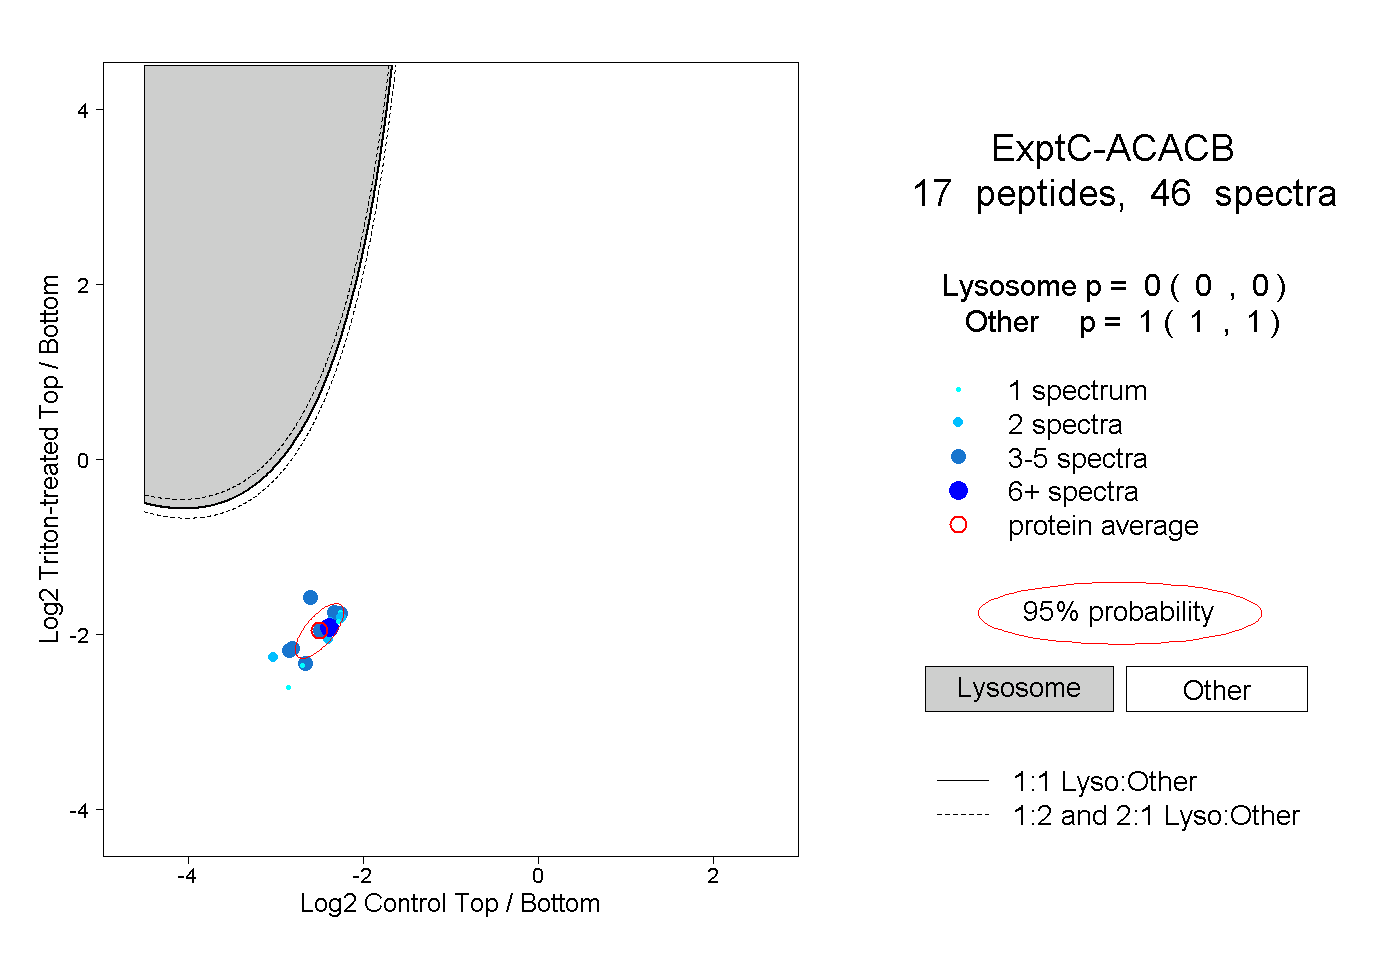
0.000 | 0.000
1.000 | 1.000