ACACB
[ENSRNOP00000060736]
Main page
| | | Plot |
Mito |
Lyso |
|
Perox |
ER |
Golgi |
PM |
Cytosol |
Nucleus |
|
| Expt A |
 28
28
peptides |
60
spectra |
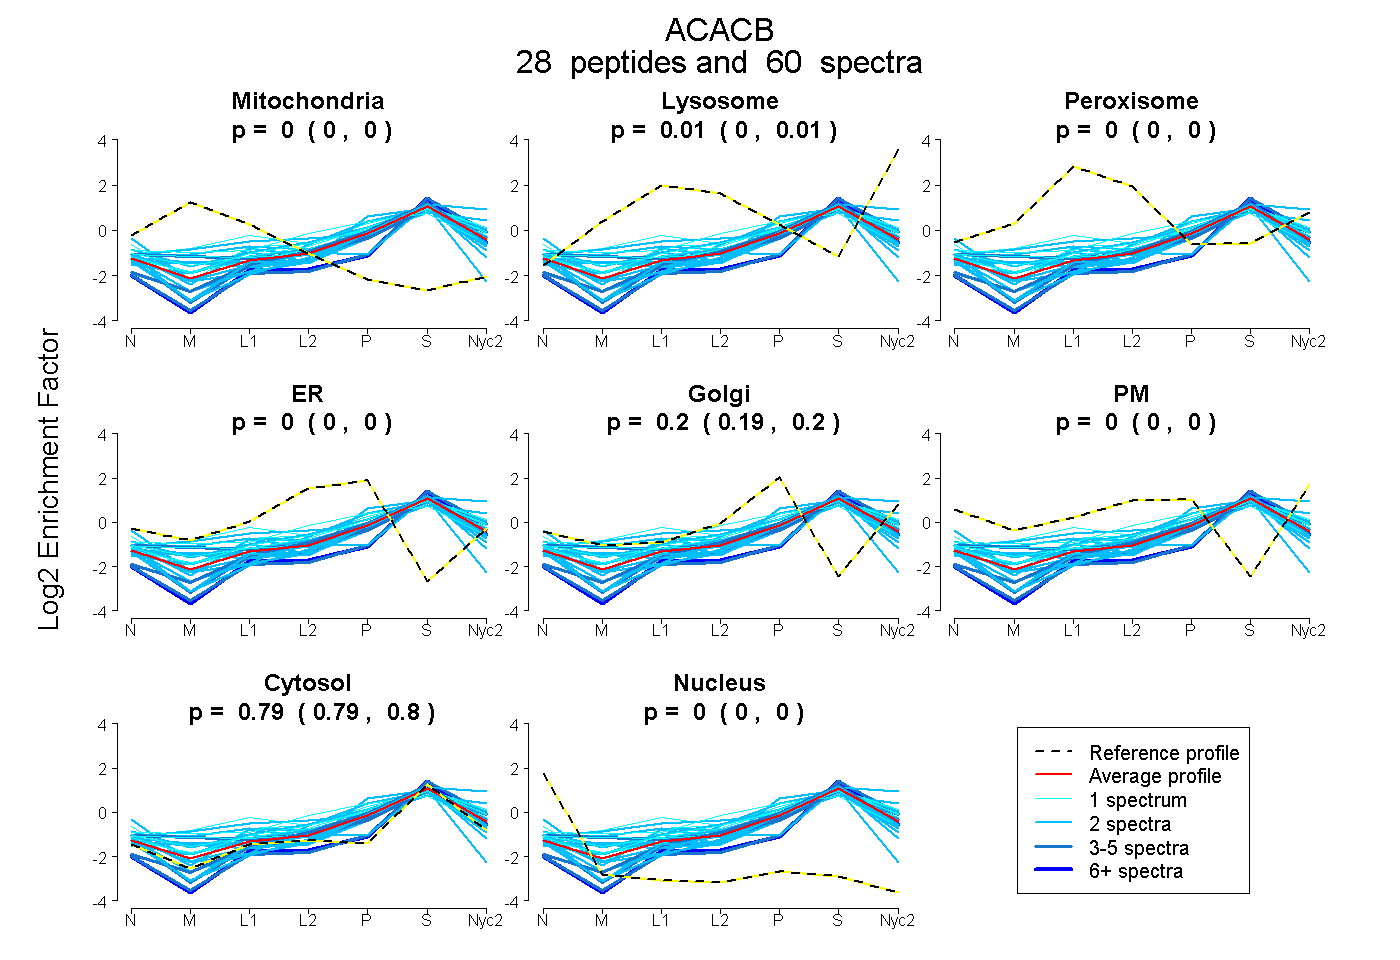 |
0.000
0.000 | 0.000 |
0.008
0.003 | 0.012 |
|
0.000
0.000 | 0.000 |
0.000
0.000 | 0.000 |
0.199
0.195 | 0.203 |
0.000
0.000 | 0.000 |
0.793
0.789 | 0.795 |
0.000
0.000 | 0.000 |
|
| | | Plot |
Mito |
|
Lyso or Perox |
|
ER |
Golgi |
PM |
Cytosol |
Nucleus |
|
| Expt B |
5
peptides |
8
spectra |
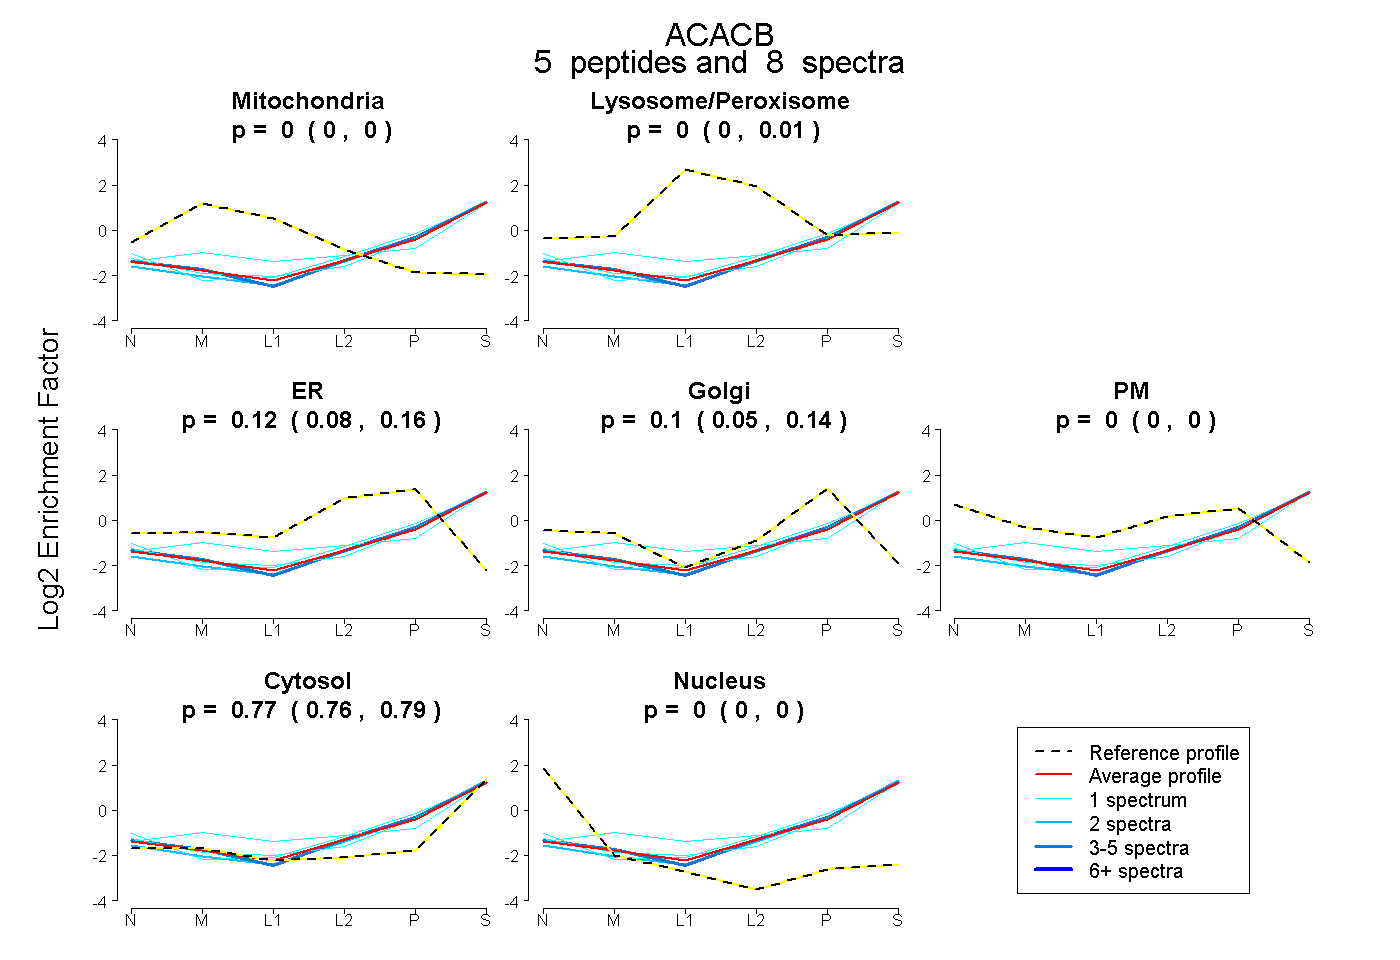 |
0.000
0.000 | 0.000 |
|
0.000
0.000 | 0.010 |
|
0.125
0.081 | 0.156 |
0.100
0.055 | 0.141 |
0.000
0.000 | 0.000 |
0.775
0.759 | 0.785 |
0.000
0.000 | 0.000 |
|
| 3 spectra, FGAYIVDSLR |
0.000 |
|
0.000 |
|
0.052 |
0.193 |
0.000 |
0.755 |
0.000 |
|
| 2 spectra, AVVLDLLR |
0.000 |
|
0.000 |
|
0.063 |
0.145 |
0.000 |
0.793 |
0.000 |
|
| 1 spectrum, HIEDEGESR |
0.000 |
|
0.040 |
|
0.000 |
0.204 |
0.000 |
0.756 |
0.000 |
|
| 1 spectrum, DVDEGLQAAEK |
0.000 |
|
0.001 |
|
0.170 |
0.096 |
0.000 |
0.734 |
0.000 |
|
| 1 spectrum, FVVMVTPEDLK |
0.000 |
|
0.191 |
|
0.000 |
0.099 |
0.000 |
0.710 |
0.000 |
|
| | | Plot |
|
Lyso |
|
|
|
|
|
|
|
Other |
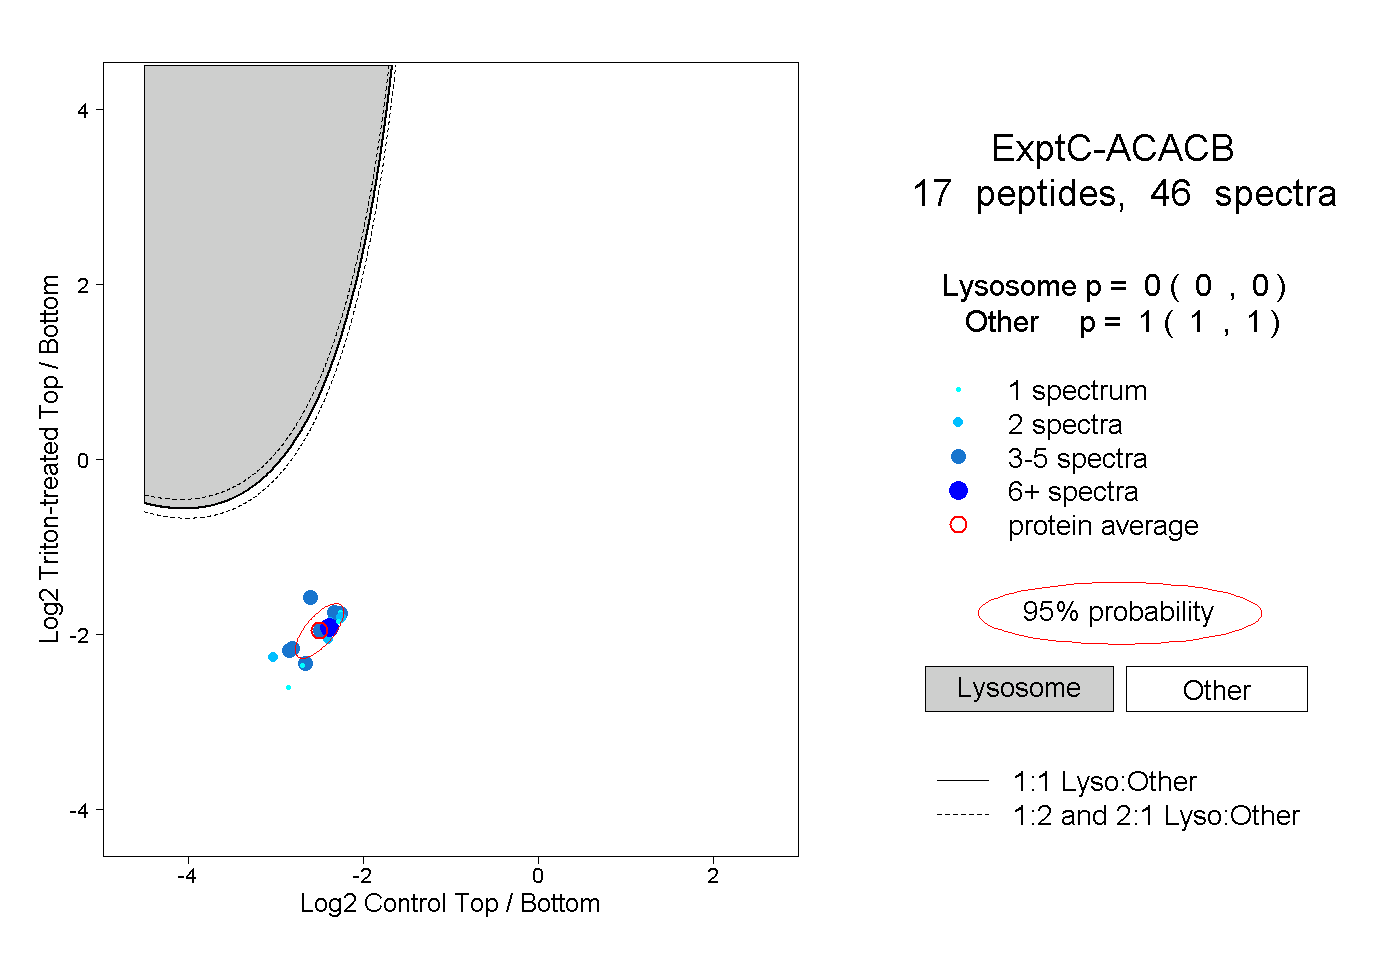
| Expt C |
17
peptides |
46
spectra |
 |
|
0.000
0.000 | 0.000 |
|
|
|
|
|
|
|
1.000
1.000 | 1.000 |
| | | Plot |
|
Lyso |
|
|
|
|
|
|
|
Other |
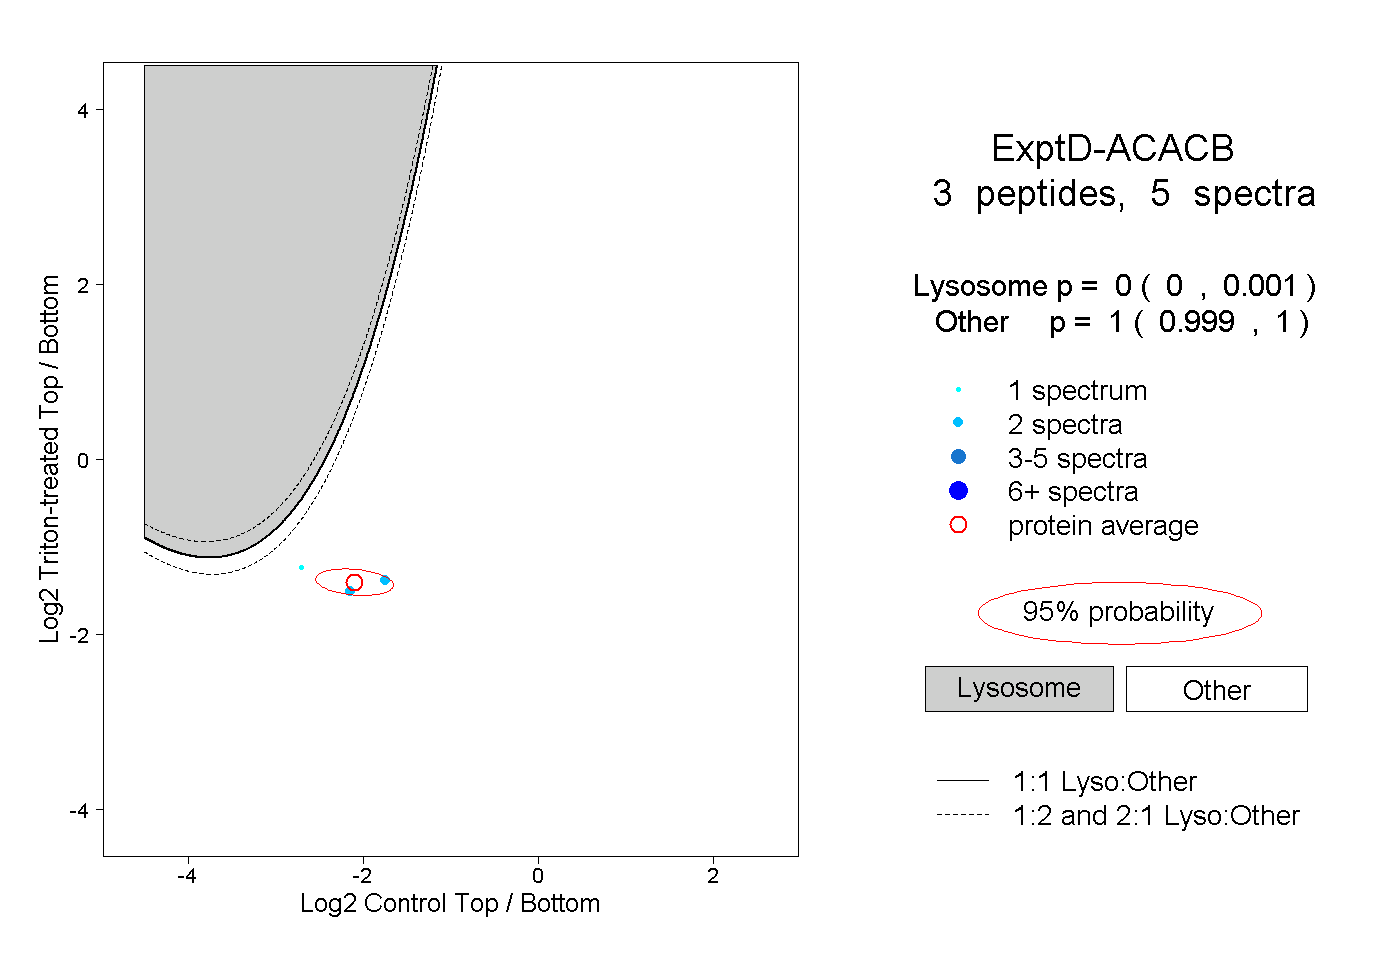
| Expt D |
3
peptides |
5
spectra |
 |
|
0.000
0.000 | 0.001 |
|
|
|
|
|
|
|
1.000
0.999 | 1.000 |