 1
1peptide
spectrum
NA | NA
NA | NA
NA | NA
NA | NA
NA | NA
NA | NA
NA | NA
NA | NA
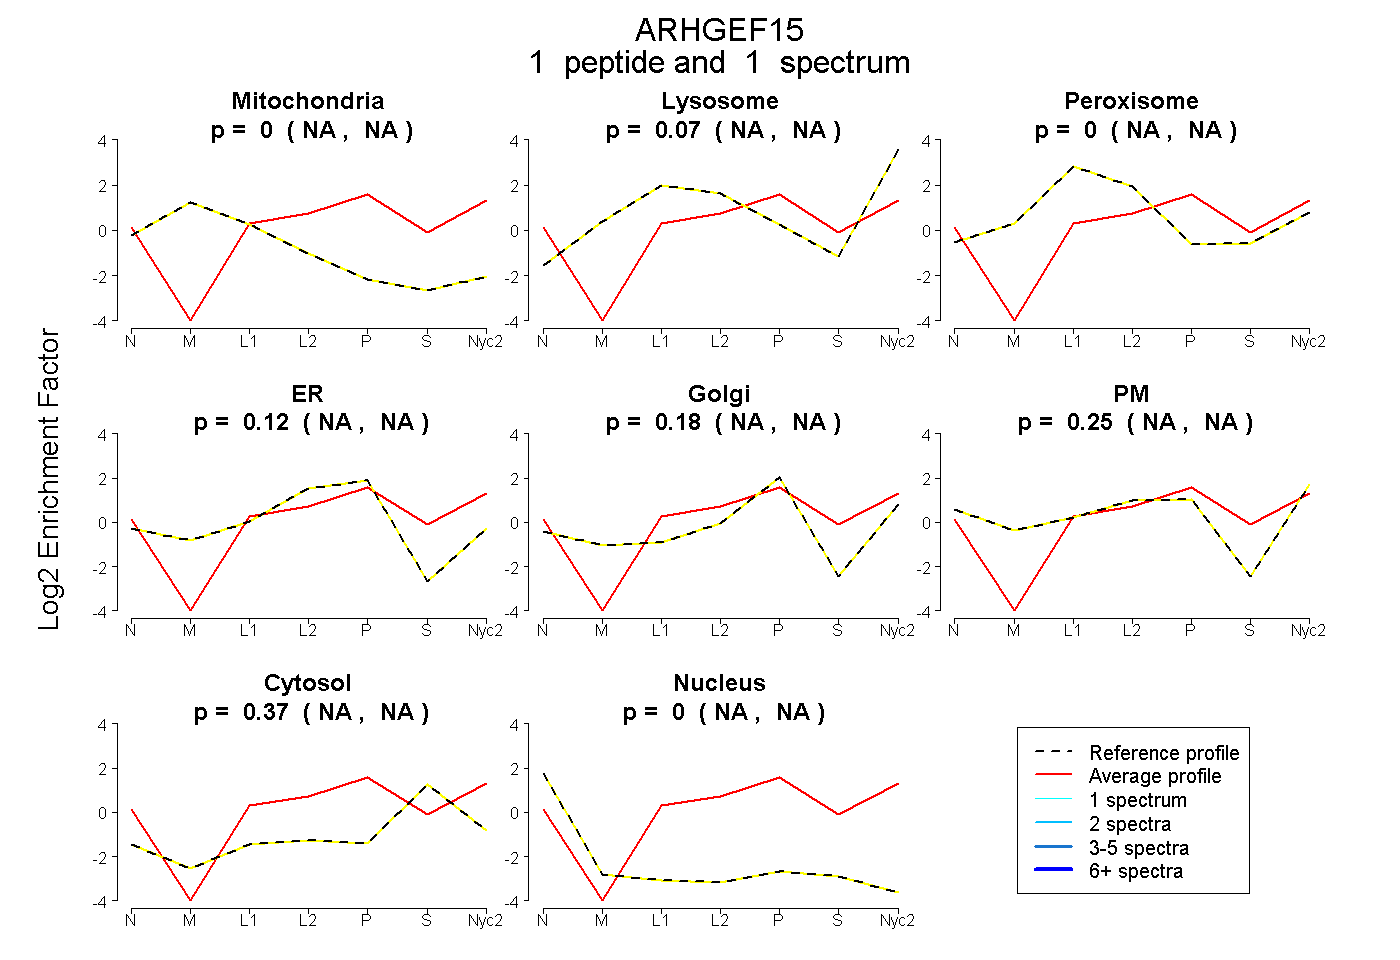
| Plot | Mito | Lyso | Perox | ER | Golgi | PM | Cytosol | Nucleus | |||||
| Expt A |
1 peptide |
1 spectrum |
|
0.000 NA | NA |
0.073 NA | NA |
0.000 NA | NA |
0.121 NA | NA |
0.183 NA | NA |
0.253 NA | NA |
0.371 NA | NA |
0.000 NA | NA |
| 1 spectrum, INPPVISHPPVVLTSYR | 0.000 | 0.073 | 0.000 | 0.121 | 0.183 | 0.253 | 0.371 | 0.000 |
| Plot | Lyso | Other | |||||||||||
| Expt C |
1 peptide |
1 spectrum |
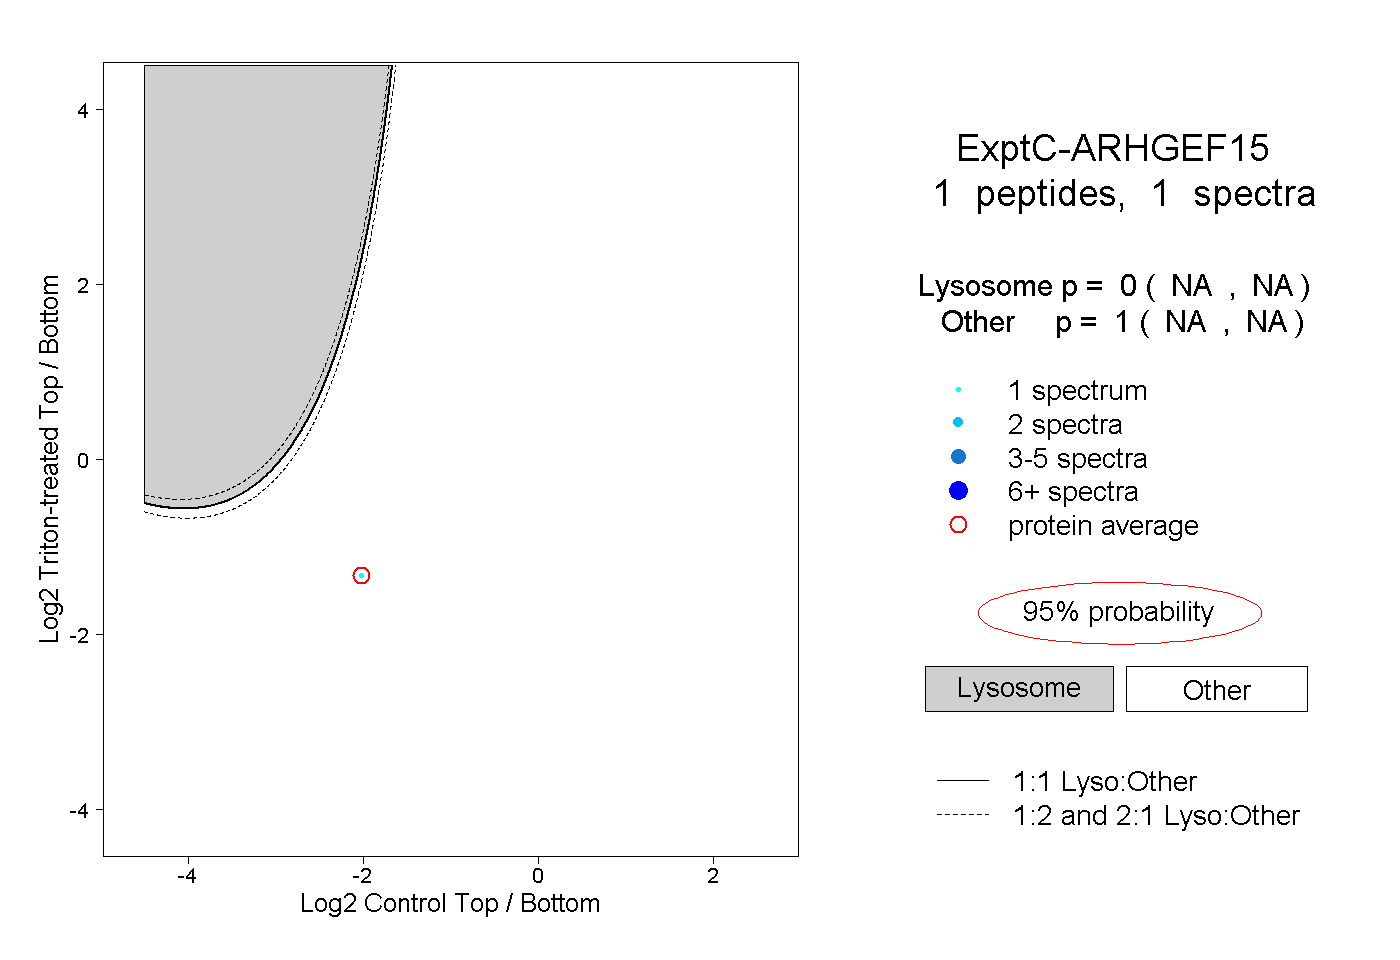 |
0.000 NA | NA |
1.000 NA | NA |