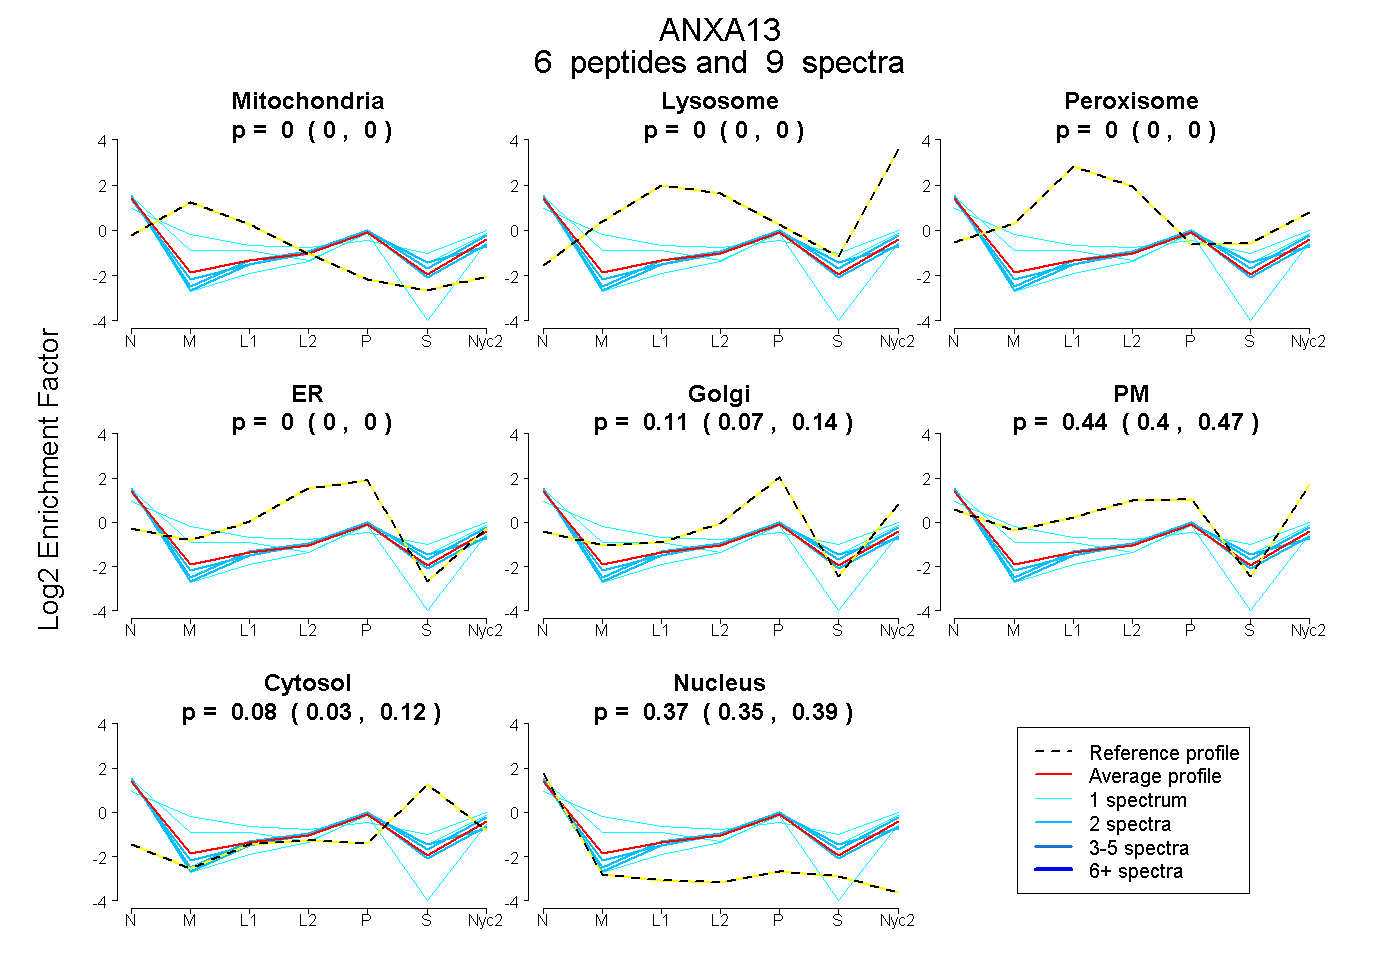
 6
6peptides
spectra
0.000 | 0.000
0.000 | 0.000
0.000 | 0.000
0.000 | 0.000
0.069 | 0.139
0.400 | 0.469
0.034 | 0.123
0.351 | 0.394
| Plot | Mito | Lyso | Perox | ER | Golgi | PM | Cytosol | Nucleus | |||||
| Expt A |
6 peptides |
9 spectra |
|
0.000 0.000 | 0.000 |
0.000 0.000 | 0.000 |
0.000 0.000 | 0.000 |
0.000 0.000 | 0.000 |
0.105 0.069 | 0.139 |
0.438 0.400 | 0.469 |
0.082 0.034 | 0.123 |
0.374 0.351 | 0.394 |
| 1 spectrum, GMGTDEAAVIEVLSSR | 0.197 | 0.000 | 0.000 | 0.000 | 0.000 | 0.469 | 0.223 | 0.111 | ||
| 1 spectrum, AYLTIVR | 0.000 | 0.000 | 0.000 | 0.000 | 0.217 | 0.245 | 0.177 | 0.361 | ||
| 1 spectrum, ATFQAYQILIGK | 0.045 | 0.000 | 0.000 | 0.000 | 0.000 | 0.555 | 0.000 | 0.400 | ||
| 2 spectra, GVGTDEETLIR | 0.000 | 0.000 | 0.000 | 0.000 | 0.198 | 0.322 | 0.062 | 0.417 | ||
| 2 spectra, LLVALLH | 0.000 | 0.000 | 0.000 | 0.000 | 0.145 | 0.327 | 0.170 | 0.357 | ||
| 2 spectra, DLYDAGEGR | 0.000 | 0.000 | 0.000 | 0.000 | 0.114 | 0.405 | 0.139 | 0.342 |
| Plot | Lyso | Other | |||||||||||
| Expt C |
3 peptides |
5 spectra |
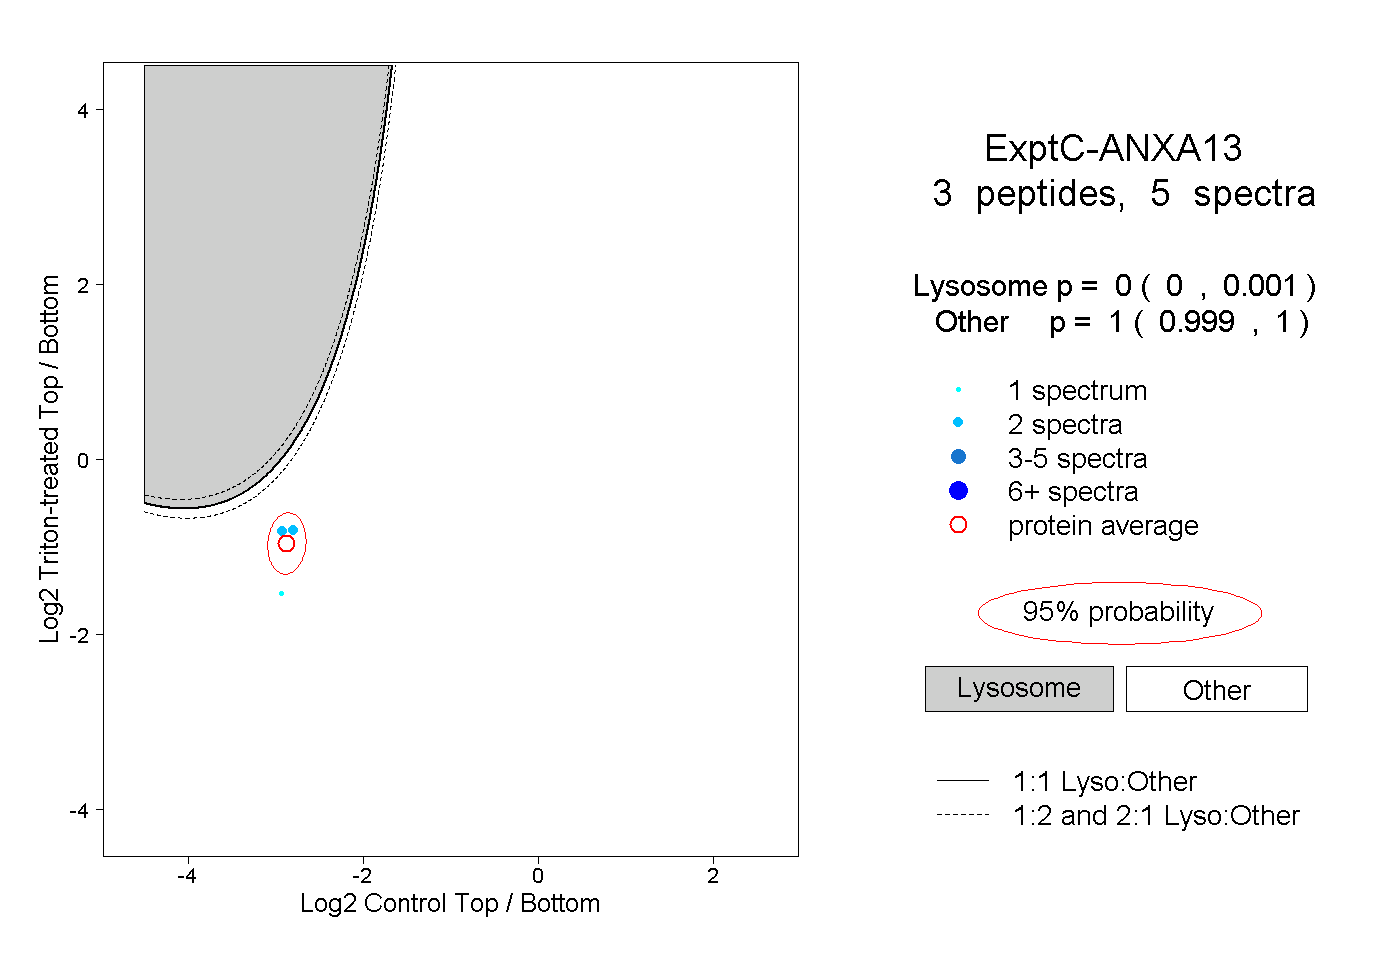 |
0.000 0.000 | 0.001 |
1.000 0.999 | 1.000 |
||||||||
| Plot | Lyso | Other | |||||||||||
| Expt D |
1 peptide |
1 spectrum |
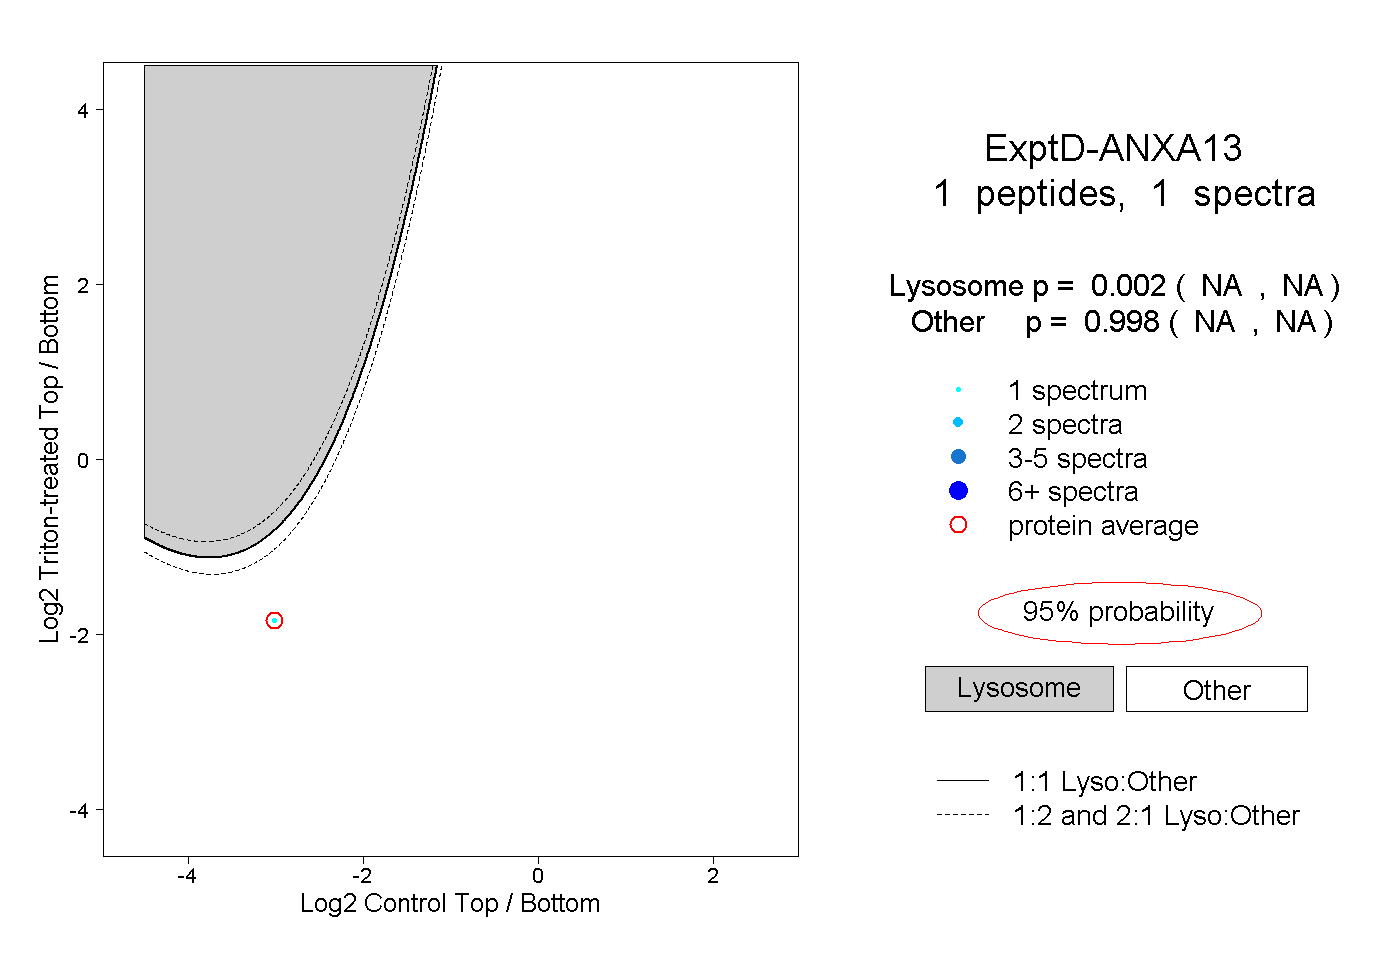 |
0.002 NA | NA |
0.998 NA | NA |