 5
5peptides
spectra
0.000 | 0.000
0.000 | 0.000
0.000 | 0.000
0.511 | 0.574
0.000 | 0.000
0.000 | 0.000
0.053 | 0.174
0.282 | 0.375
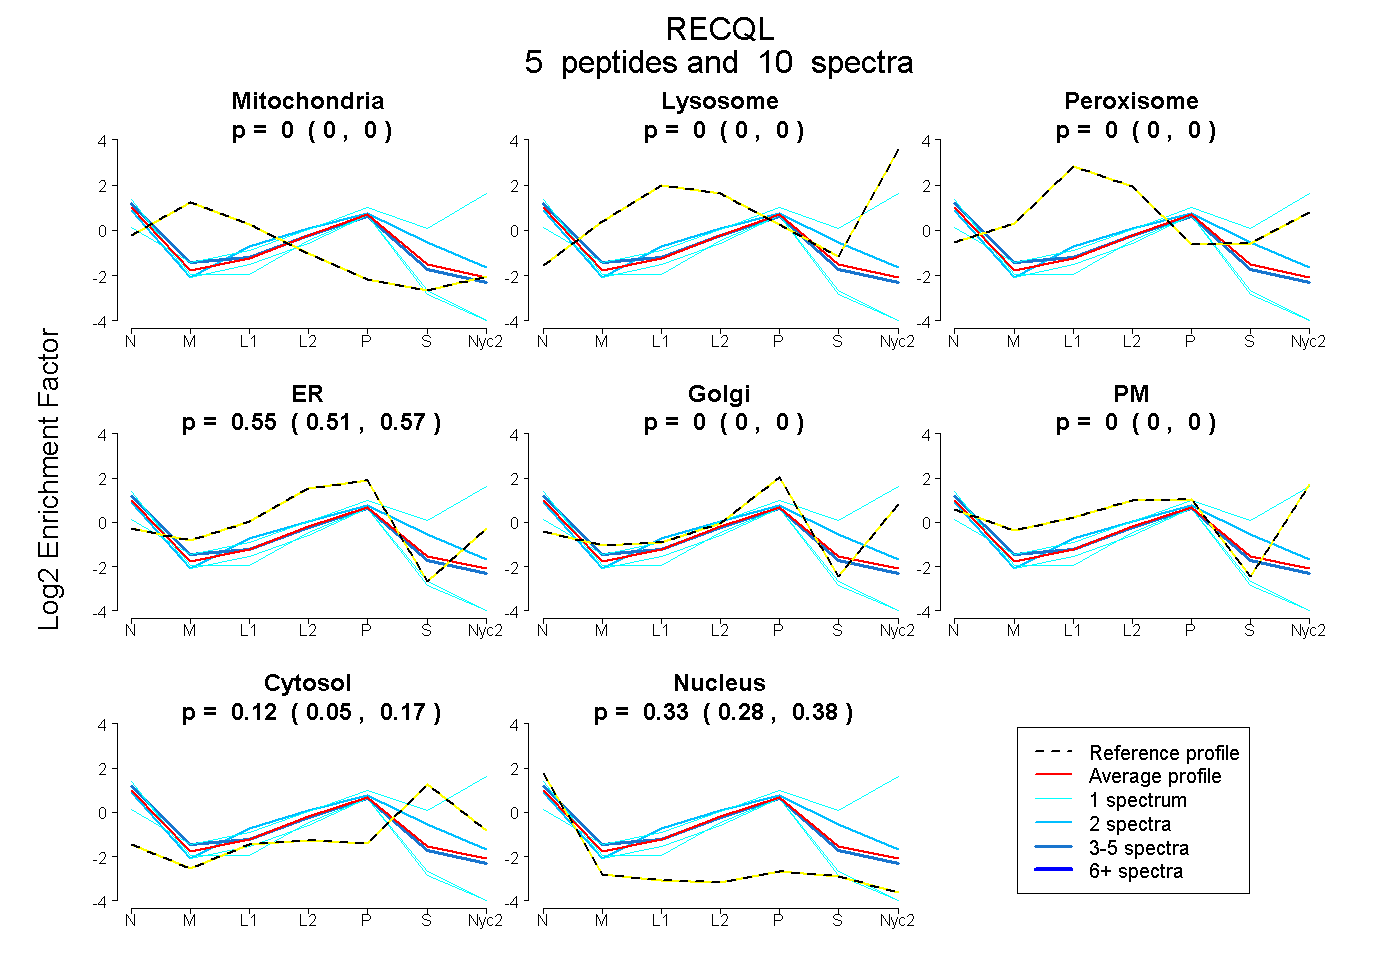
| Plot | Mito | Lyso | Perox | ER | Golgi | PM | Cytosol | Nucleus | |||||
| Expt A |
5 peptides |
10 spectra |
|
0.000 0.000 | 0.000 |
0.000 0.000 | 0.000 |
0.000 0.000 | 0.000 |
0.549 0.511 | 0.574 |
0.000 0.000 | 0.000 |
0.000 0.000 | 0.000 |
0.119 0.053 | 0.174 |
0.332 0.282 | 0.375 |
| 1 spectrum, LIDAWMGK | 0.000 | 0.094 | 0.000 | 0.000 | 0.185 | 0.356 | 0.365 | 0.000 | ||
| 2 spectra, AGTYHANMEPEDR | 0.000 | 0.000 | 0.000 | 0.509 | 0.000 | 0.000 | 0.313 | 0.178 | ||
| 1 spectrum, VAGVAVPALPR | 0.000 | 0.000 | 0.000 | 0.451 | 0.000 | 0.000 | 0.000 | 0.549 | ||
| 5 spectra, FRPLQLETVNATMAR | 0.000 | 0.000 | 0.000 | 0.572 | 0.000 | 0.000 | 0.048 | 0.379 | ||
| 1 spectrum, SMENYYQESGR | 0.000 | 0.000 | 0.000 | 0.457 | 0.000 | 0.000 | 0.000 | 0.543 |