 1
1peptide
spectra
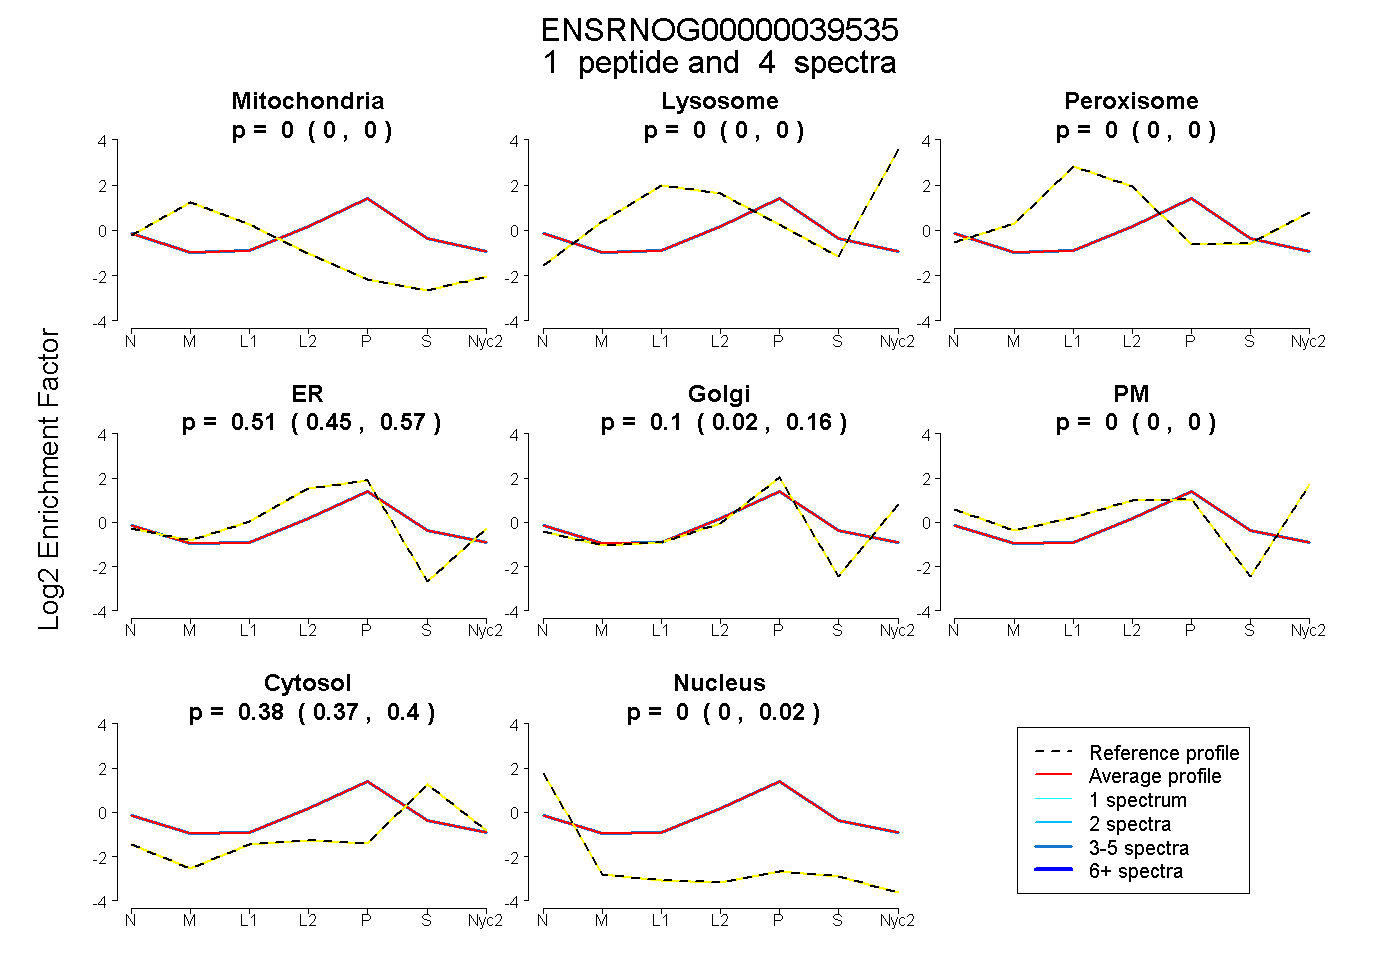
0.000 | 0.000
0.000 | 0.000
0.000 | 0.000
0.450 | 0.572
0.022 | 0.164
0.000 | 0.000
0.365 | 0.396
0.000 | 0.015
1peptide
spectrum
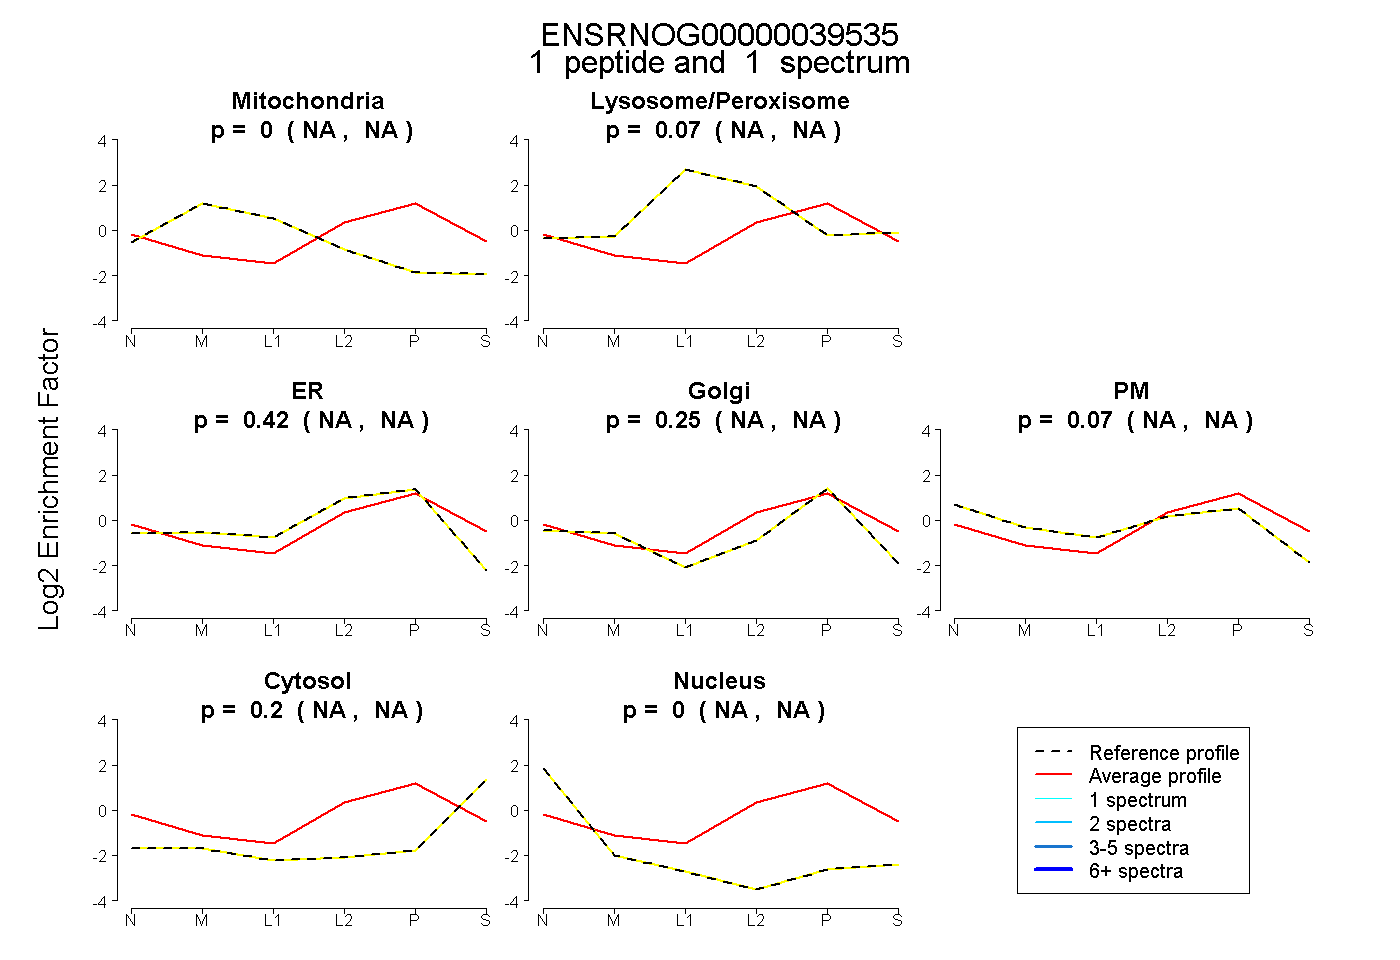
NA | NA
NA | NA
NA | NA
NA | NA
NA | NA
NA | NA
NA | NA
2peptides
spectra
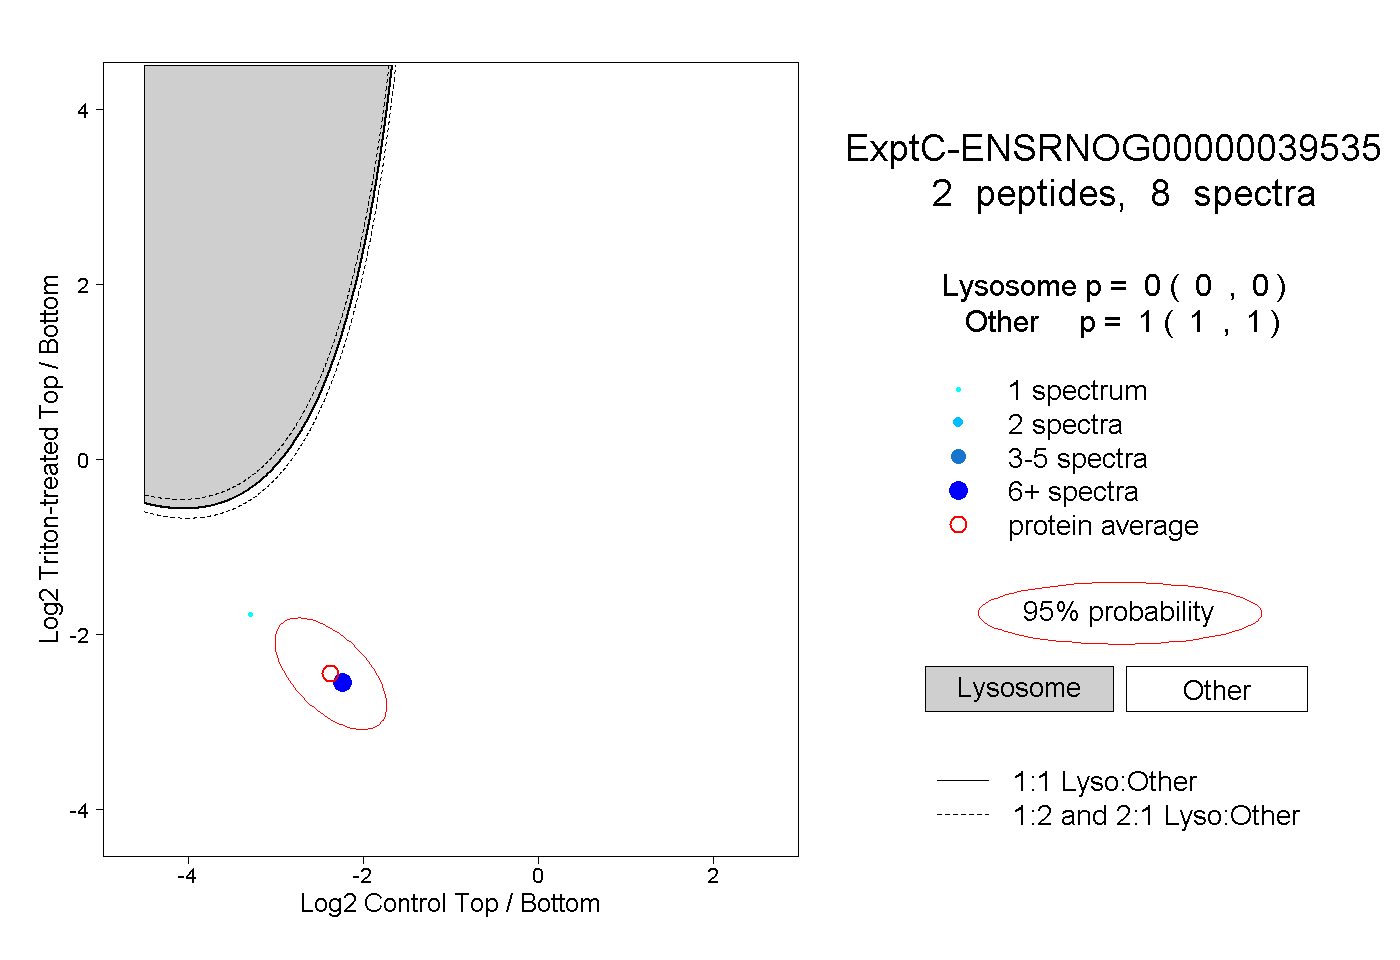
0.000 | 0.000
1.000 | 1.000