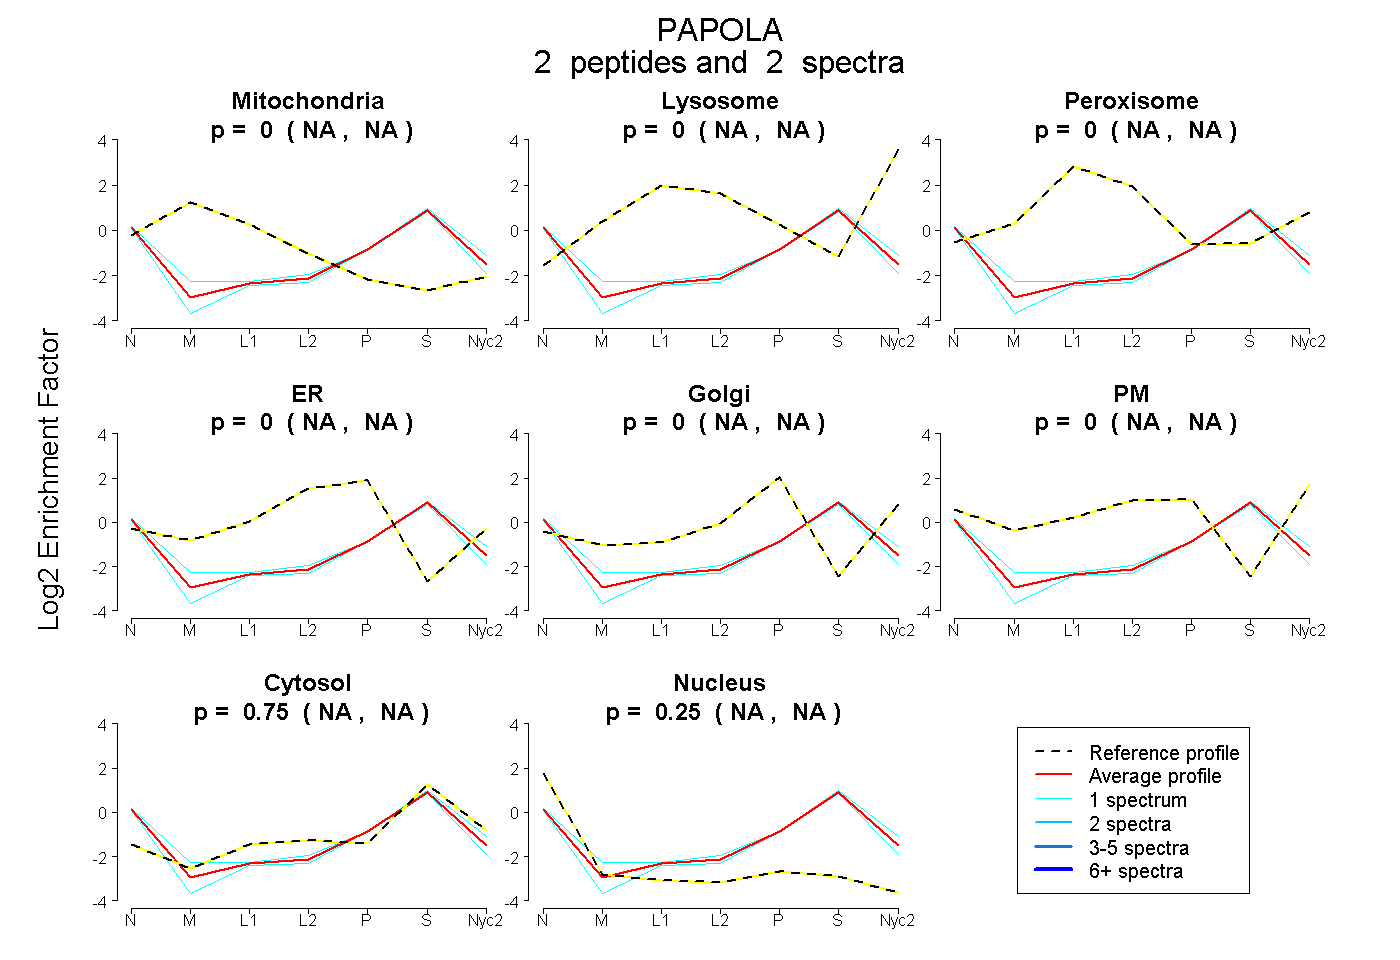
 2
2peptides
spectra
NA | NA
NA | NA
NA | NA
NA | NA
NA | NA
NA | NA
NA | NA
NA | NA
| Plot | Mito | Lyso | Perox | ER | Golgi | PM | Cytosol | Nucleus | |||||
| Expt A |
2 peptides |
2 spectra |
|
0.000 NA | NA |
0.000 NA | NA |
0.000 NA | NA |
0.000 NA | NA |
0.000 NA | NA |
0.000 NA | NA |
0.749 NA | NA |
0.251 NA | NA |
| 1 spectrum, IFTFGSYR | 0.000 | 0.000 | 0.000 | 0.000 | 0.024 | 0.000 | 0.707 | 0.270 | ||
| 1 spectrum, LIETLKPFGVFEEEEELQR | 0.000 | 0.000 | 0.000 | 0.000 | 0.000 | 0.000 | 0.770 | 0.230 |
| Plot | Mito | Lyso or Perox | ER | Golgi | PM | Cytosol | Nucleus | ||||||
| Expt B |
1 peptide |
1 spectrum |
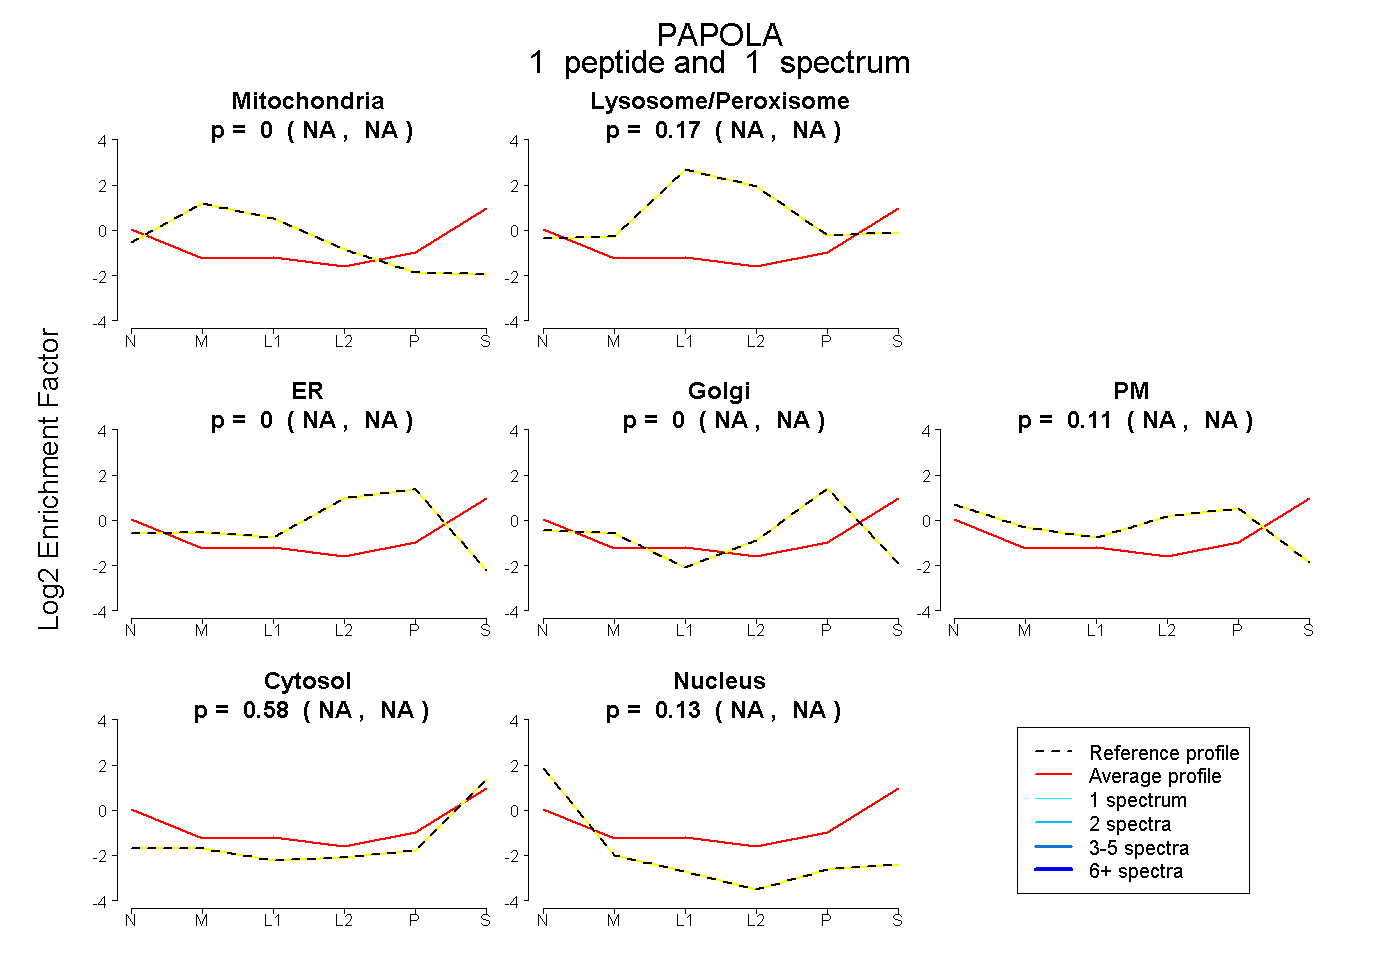 |
0.000 NA | NA |
0.172 NA | NA |
0.000 NA | NA |
0.000 NA | NA |
0.115 NA | NA |
0.585 NA | NA |
0.129 NA | NA |