 14
14peptides
spectra
0.000 | 0.000
1.000 | 1.000
0.000 | 0.000
0.000 | 0.000
0.000 | 0.000
0.000 | 0.000
0.000 | 0.000
0.000 | 0.000
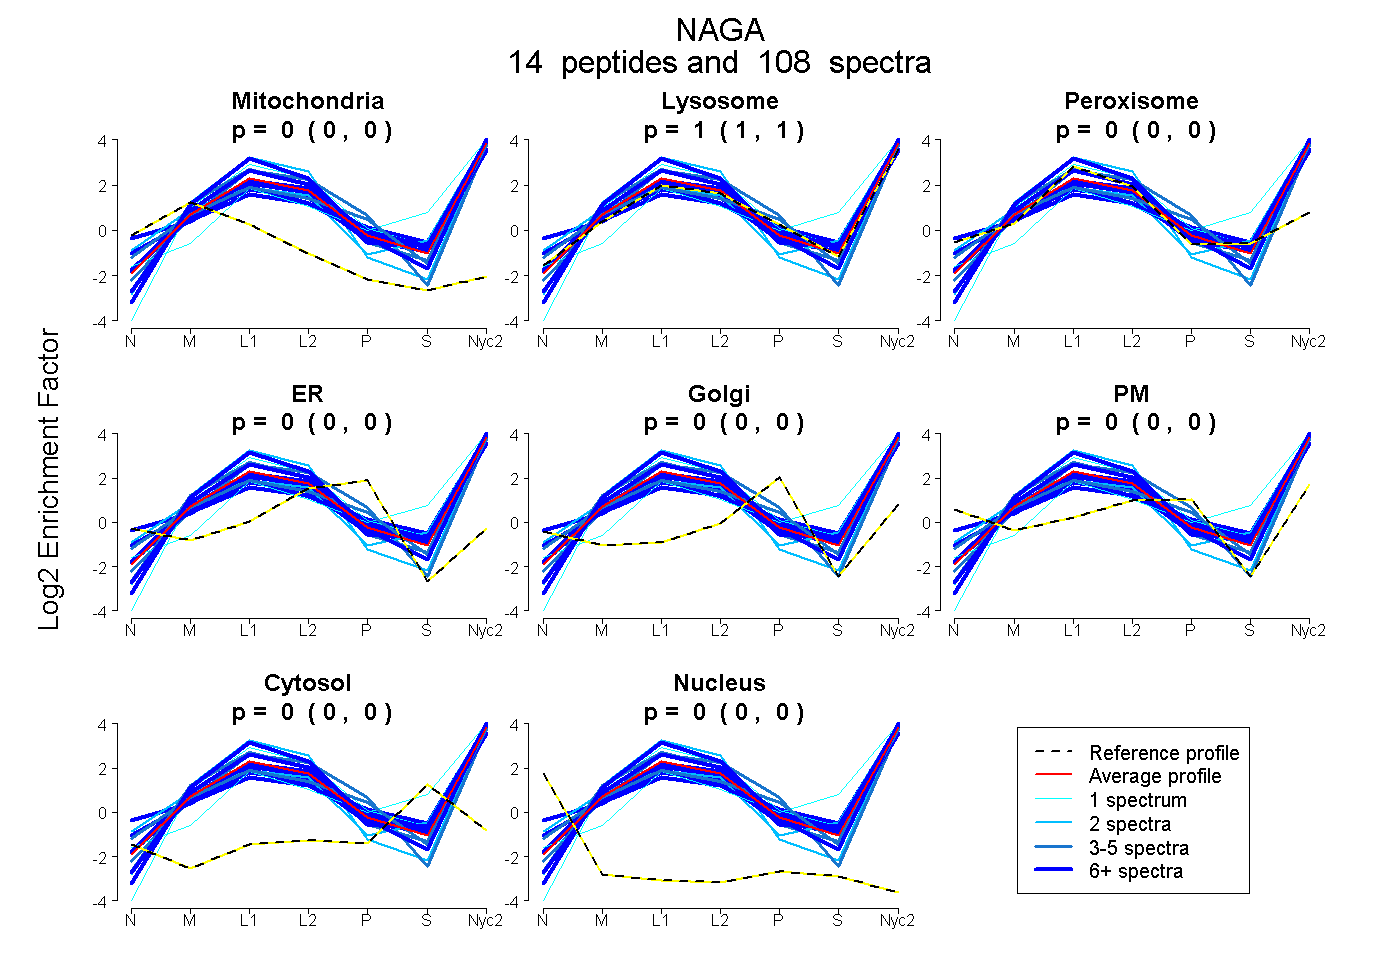
| Plot | Mito | Lyso | Perox | ER | Golgi | PM | Cytosol | Nucleus | |||||
| Expt A |
14 peptides |
108 spectra |
|
0.000 0.000 | 0.000 |
1.000 1.000 | 1.000 |
0.000 0.000 | 0.000 |
0.000 0.000 | 0.000 |
0.000 0.000 | 0.000 |
0.000 0.000 | 0.000 |
0.000 0.000 | 0.000 |
0.000 0.000 | 0.000 |
| 7 spectra, NLSDDASALVFFSR | 0.000 | 1.000 | 0.000 | 0.000 | 0.000 | 0.000 | 0.000 | 0.000 | ||
| 7 spectra, AEGYPK | 0.000 | 0.896 | 0.019 | 0.000 | 0.000 | 0.073 | 0.012 | 0.000 | ||
| 16 spectra, LGIYEDMGK | 0.000 | 0.933 | 0.000 | 0.000 | 0.000 | 0.000 | 0.045 | 0.023 | ||
| 19 spectra, TPPMGWLAWER | 0.000 | 1.000 | 0.000 | 0.000 | 0.000 | 0.000 | 0.000 | 0.000 | ||
| 1 spectrum, MTCMGYPGTTLDK | 0.000 | 0.855 | 0.000 | 0.000 | 0.000 | 0.000 | 0.145 | 0.000 | ||
| 2 spectra, LDGCYSTPK | 0.004 | 0.920 | 0.076 | 0.000 | 0.000 | 0.000 | 0.000 | 0.000 | ||
| 2 spectra, CNINCEEDPK | 0.000 | 1.000 | 0.000 | 0.000 | 0.000 | 0.000 | 0.000 | 0.000 | ||
| 1 spectrum, FPHGIAFLADYAHSLGLK | 0.000 | 1.000 | 0.000 | 0.000 | 0.000 | 0.000 | 0.000 | 0.000 | ||
| 5 spectra, SHIEVFK | 0.000 | 0.933 | 0.000 | 0.000 | 0.000 | 0.067 | 0.000 | 0.000 | ||
| 3 spectra, LIPDPK | 0.000 | 1.000 | 0.000 | 0.000 | 0.000 | 0.000 | 0.000 | 0.000 | ||
| 15 spectra, INQDPLGIQGR | 0.000 | 1.000 | 0.000 | 0.000 | 0.000 | 0.000 | 0.000 | 0.000 | ||
| 7 spectra, LAQDGWR | 0.022 | 0.951 | 0.000 | 0.000 | 0.000 | 0.000 | 0.027 | 0.000 | ||
| 19 spectra, LFMEMADR | 0.000 | 1.000 | 0.000 | 0.000 | 0.000 | 0.000 | 0.000 | 0.000 | ||
| 4 spectra, DIQDSWK | 0.000 | 1.000 | 0.000 | 0.000 | 0.000 | 0.000 | 0.000 | 0.000 |
| Plot | Mito | Lyso or Perox | ER | Golgi | PM | Cytosol | Nucleus | ||||||
| Expt B |
12 peptides |
33 spectra |
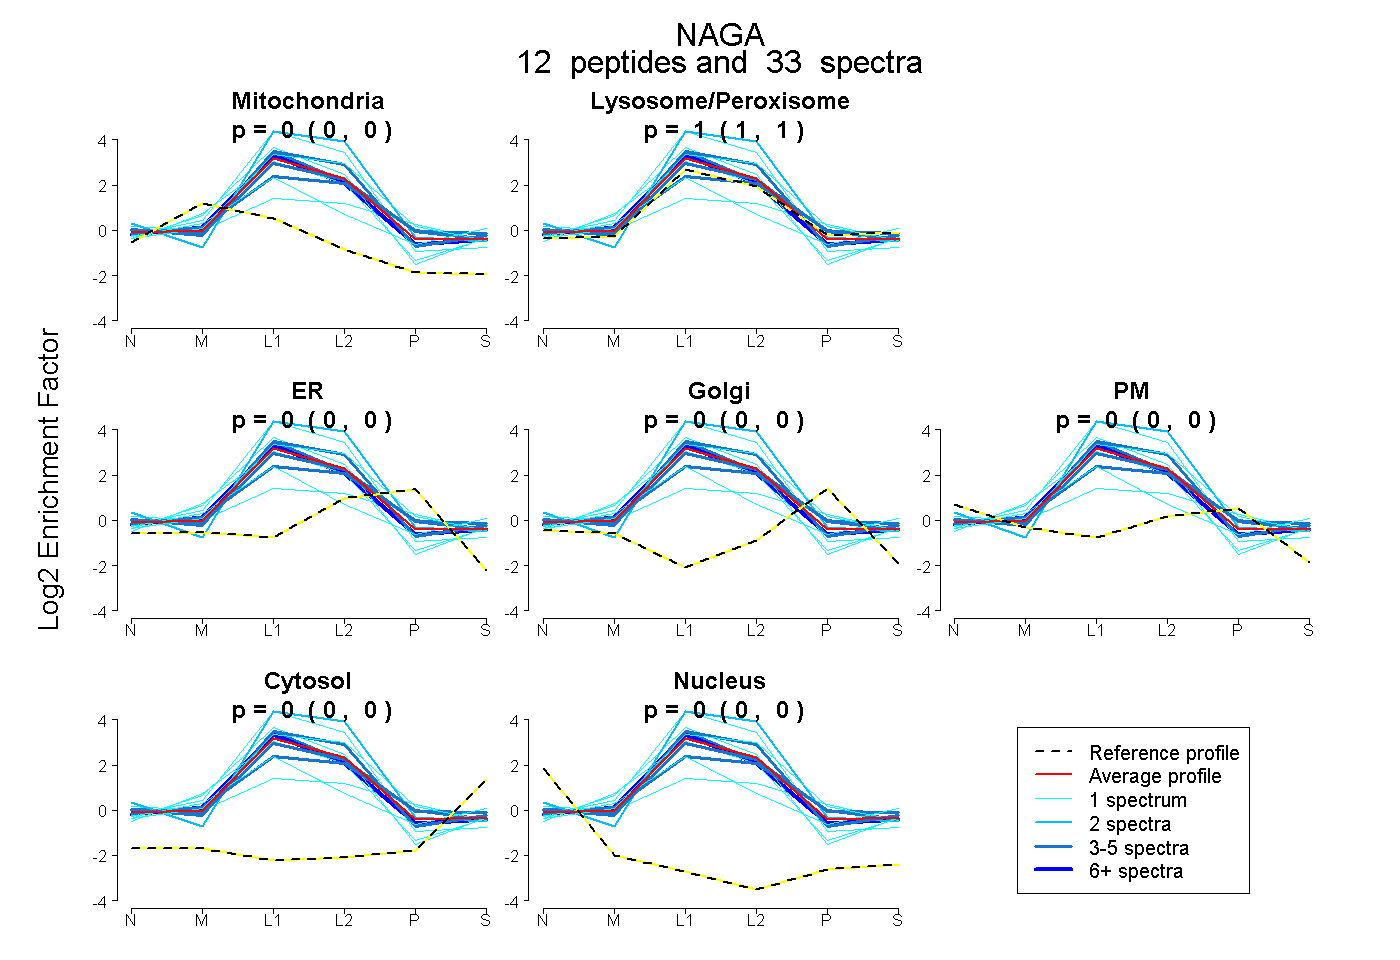 |
0.000 0.000 | 0.000 |
1.000 1.000 | 1.000 |
0.000 0.000 | 0.000 |
0.000 0.000 | 0.000 |
0.000 0.000 | 0.000 |
0.000 0.000 | 0.000 |
0.000 0.000 | 0.000 |
|||
| Plot | Lyso | Other | |||||||||||
| Expt C |
16 peptides |
381 spectra |
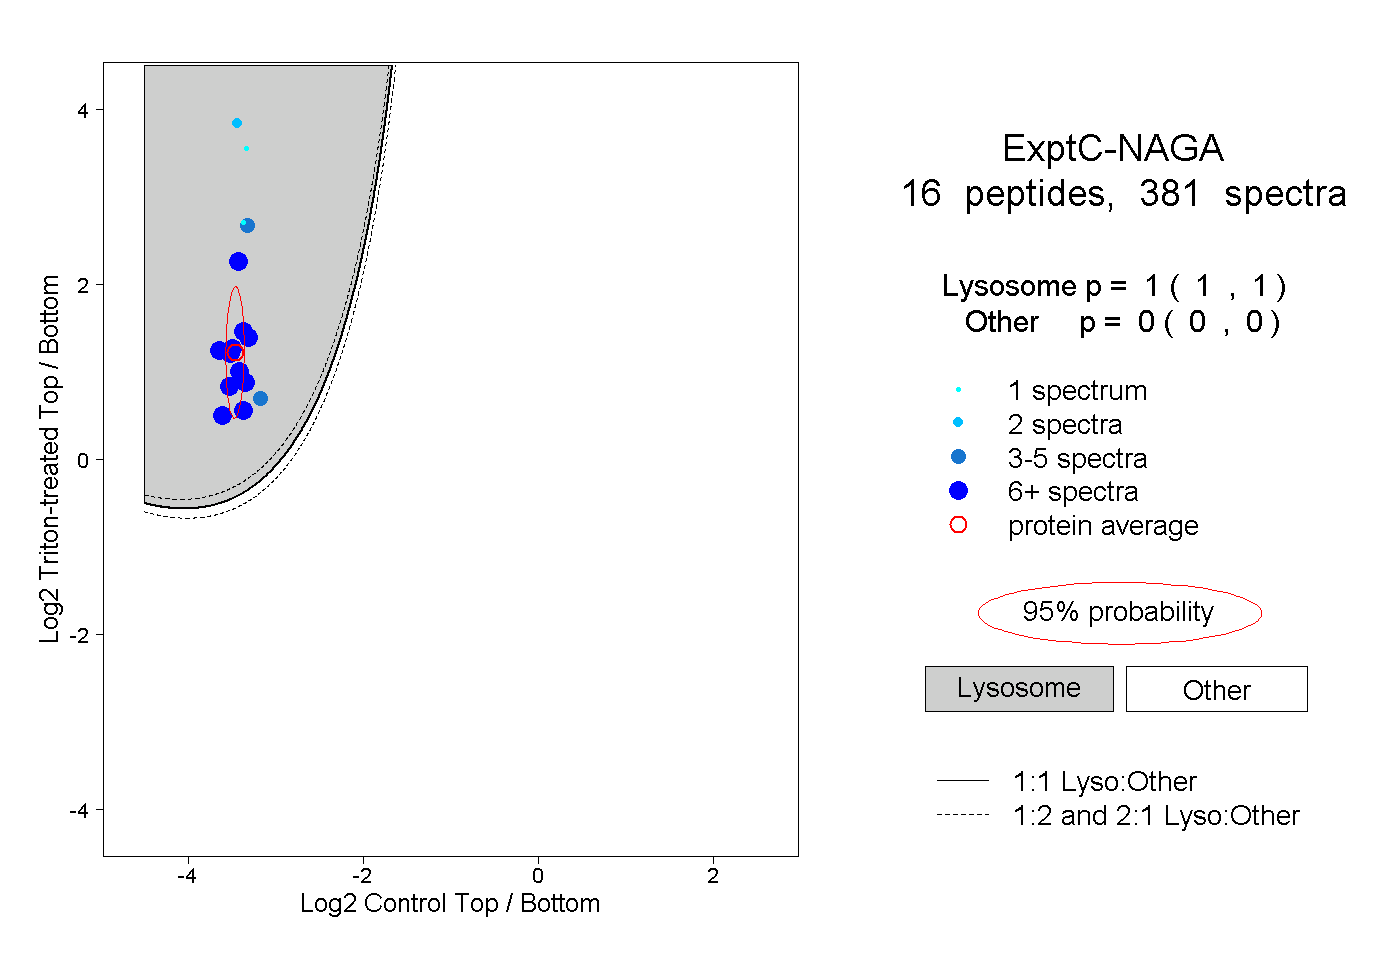 |
1.000 1.000 | 1.000 |
0.000 0.000 | 0.000 |
||||||||
| Plot | Lyso | Other | |||||||||||
| Expt D |
7 peptides |
25 spectra |
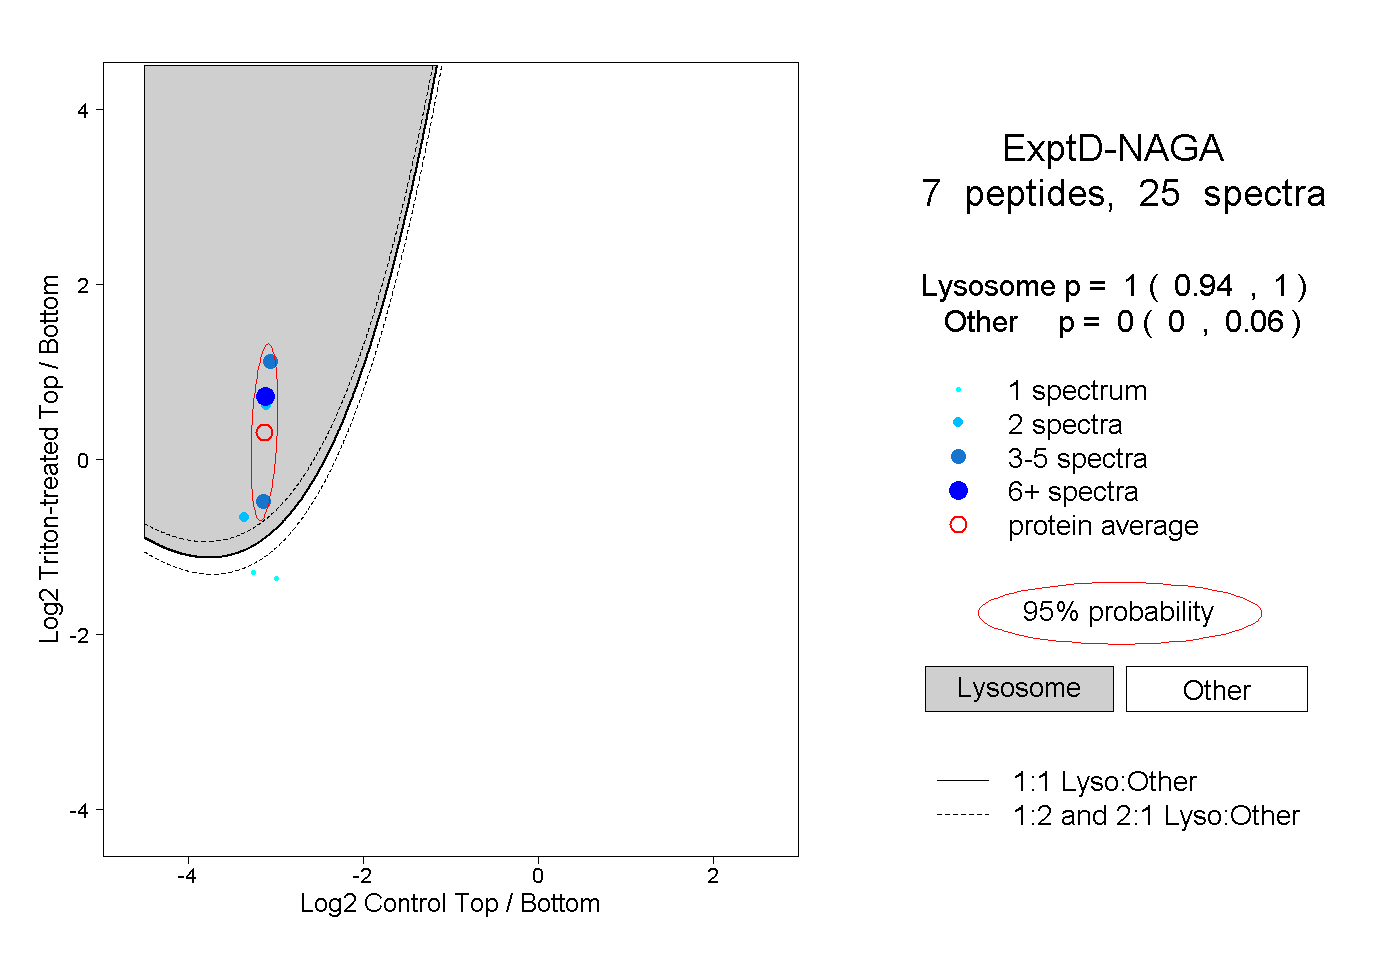 |
1.000 0.940 | 1.000 |
0.000 0.000 | 0.060 |