 3
3peptides
spectra
0.000 | 0.000
0.000 | 0.000
0.000 | 0.000
0.951 | 0.960
0.000 | 0.000
0.000 | 0.000
0.000 | 0.000
0.039 | 0.048
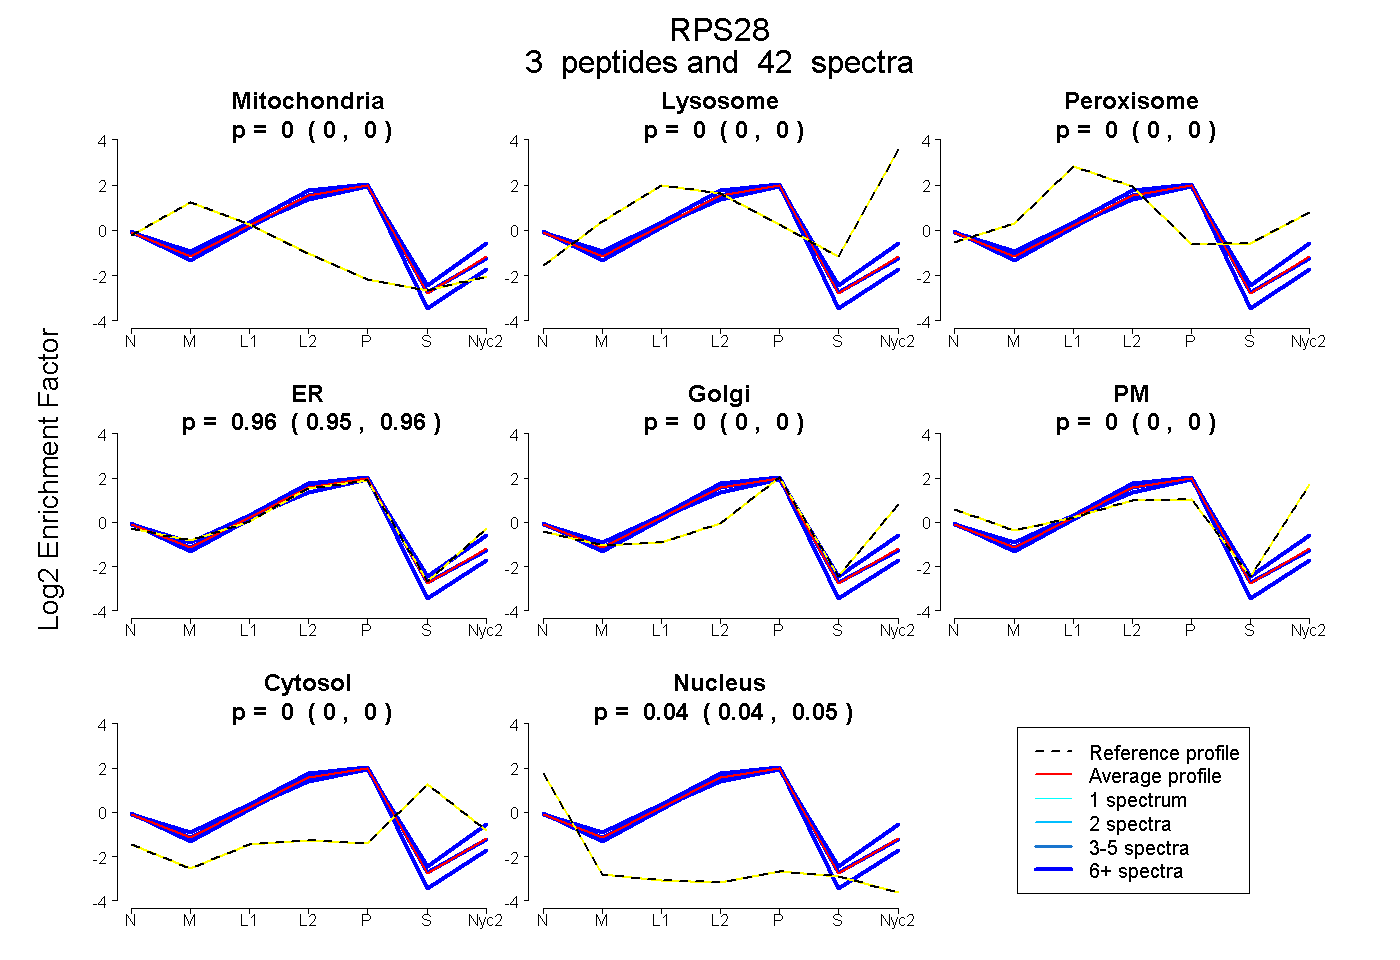
| Plot | Mito | Lyso | Perox | ER | Golgi | PM | Cytosol | Nucleus | |||||
| Expt A |
3 peptides |
42 spectra |
|
0.000 0.000 | 0.000 |
0.000 0.000 | 0.000 |
0.000 0.000 | 0.000 |
0.956 0.951 | 0.960 |
0.000 0.000 | 0.000 |
0.000 0.000 | 0.000 |
0.000 0.000 | 0.000 |
0.044 0.039 | 0.048 |
| 6 spectra, TGSQGQCTQVR | 0.000 | 0.000 | 0.000 | 0.955 | 0.000 | 0.000 | 0.000 | 0.045 | ||
| 21 spectra, EGDVLTLLESER | 0.000 | 0.000 | 0.000 | 0.945 | 0.000 | 0.000 | 0.000 | 0.055 | ||
| 15 spectra, VEFMDDTSR | 0.000 | 0.000 | 0.000 | 0.961 | 0.000 | 0.000 | 0.018 | 0.021 |
| Plot | Mito | Lyso or Perox | ER | Golgi | PM | Cytosol | Nucleus | ||||||
| Expt B |
3 peptides |
14 spectra |
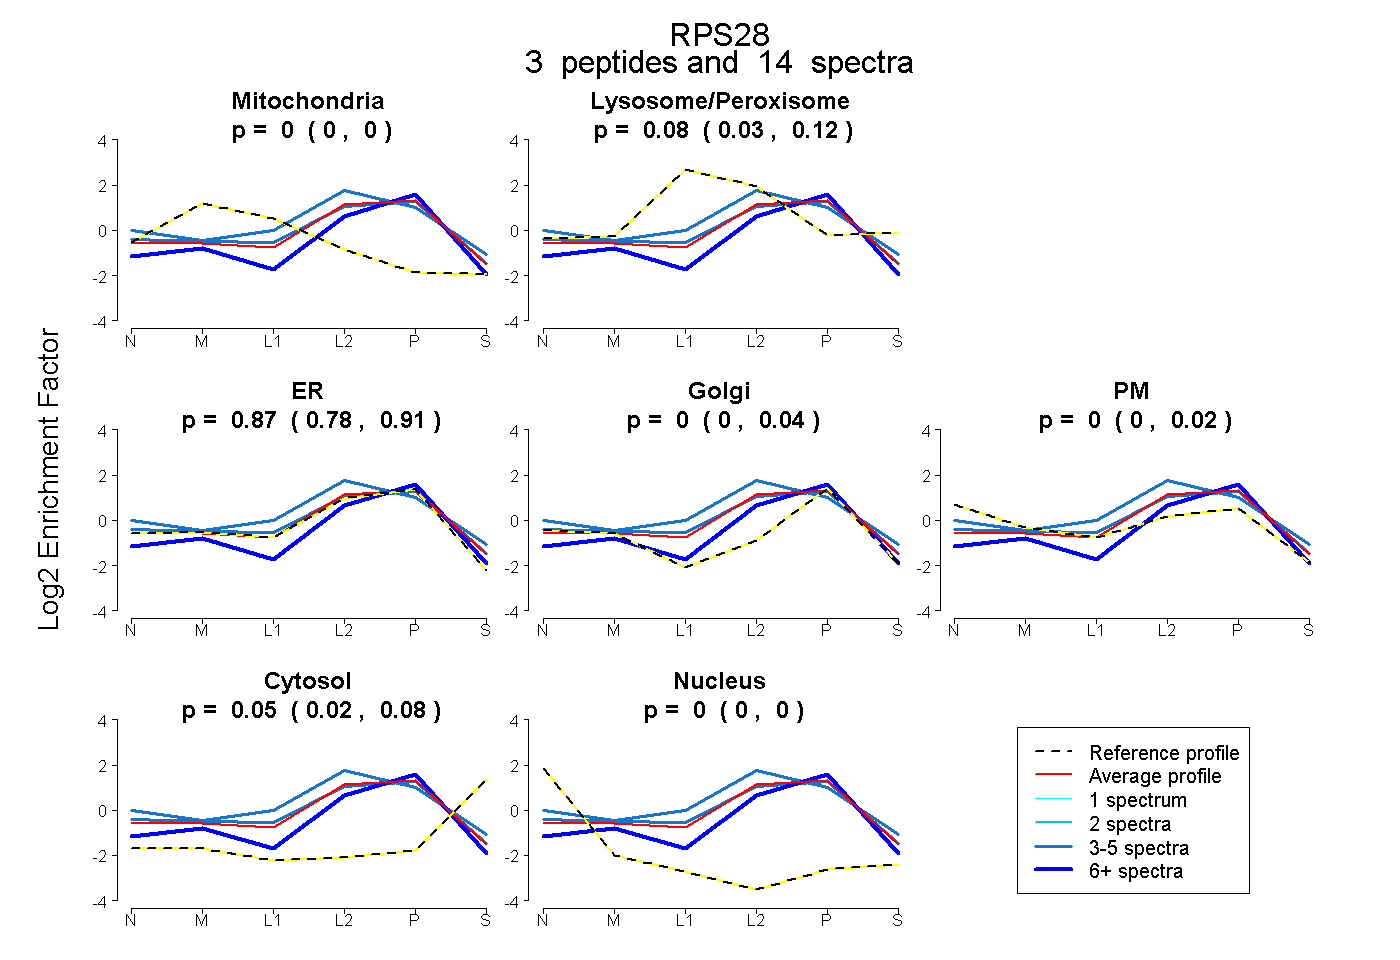 |
0.000 0.000 | 0.000 |
0.077 0.025 | 0.122 |
0.870 0.781 | 0.906 |
0.000 0.000 | 0.037 |
0.000 0.000 | 0.018 |
0.053 0.024 | 0.076 |
0.000 0.000 | 0.000 |
|||
| Plot | Lyso | Other | |||||||||||
| Expt C |
3 peptides |
94 spectra |
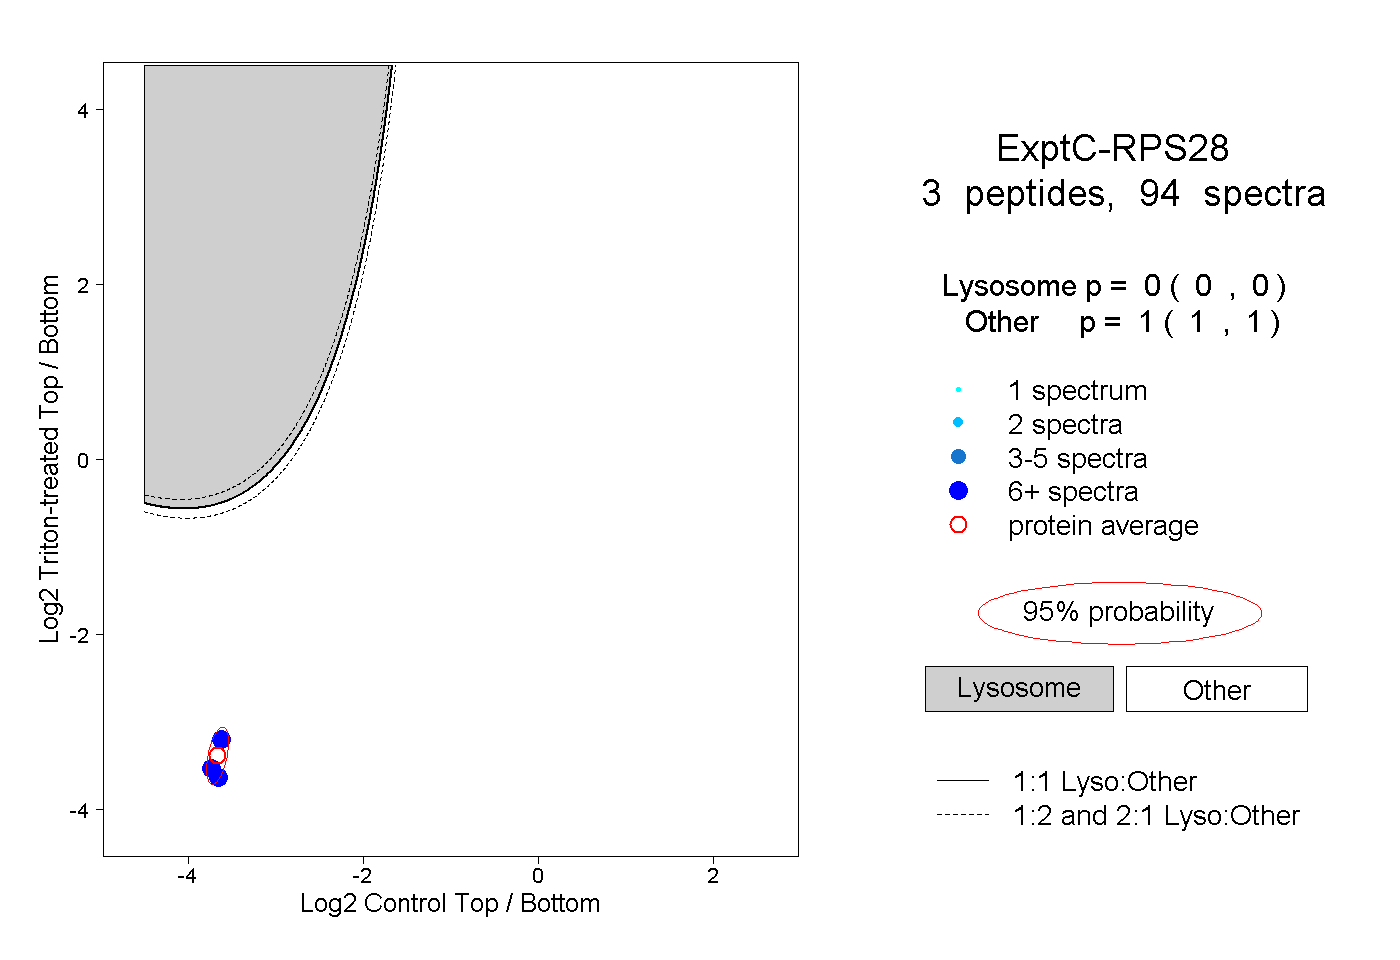 |
0.000 0.000 | 0.000 |
1.000 1.000 | 1.000 |
||||||||
| Plot | Lyso | Other | |||||||||||
| Expt D |
1 peptide |
1 spectrum |
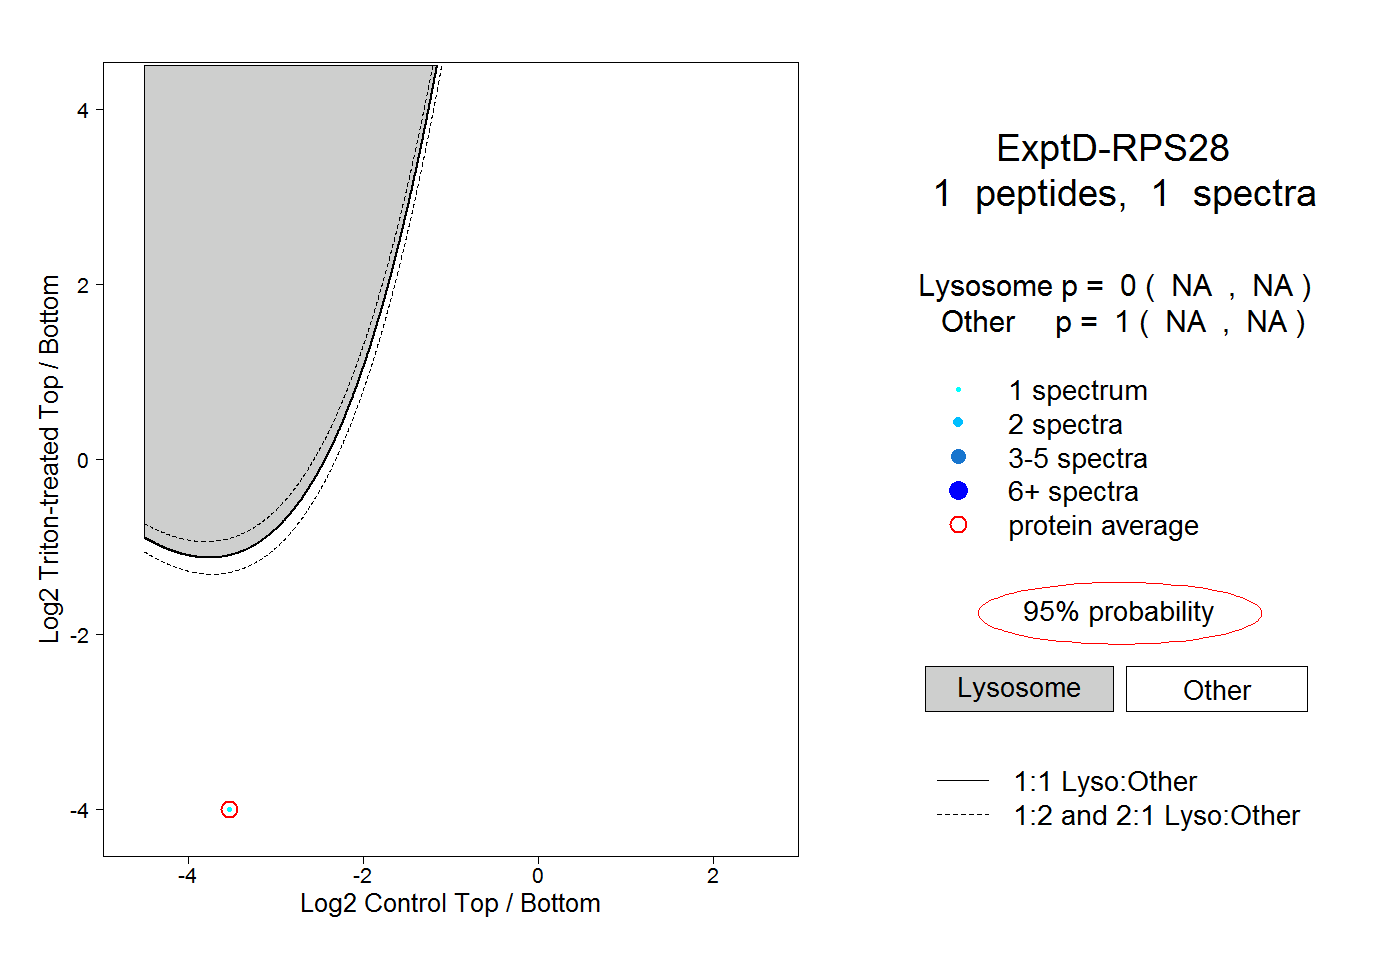 |
0.000 NA | NA |
1.000 NA | NA |