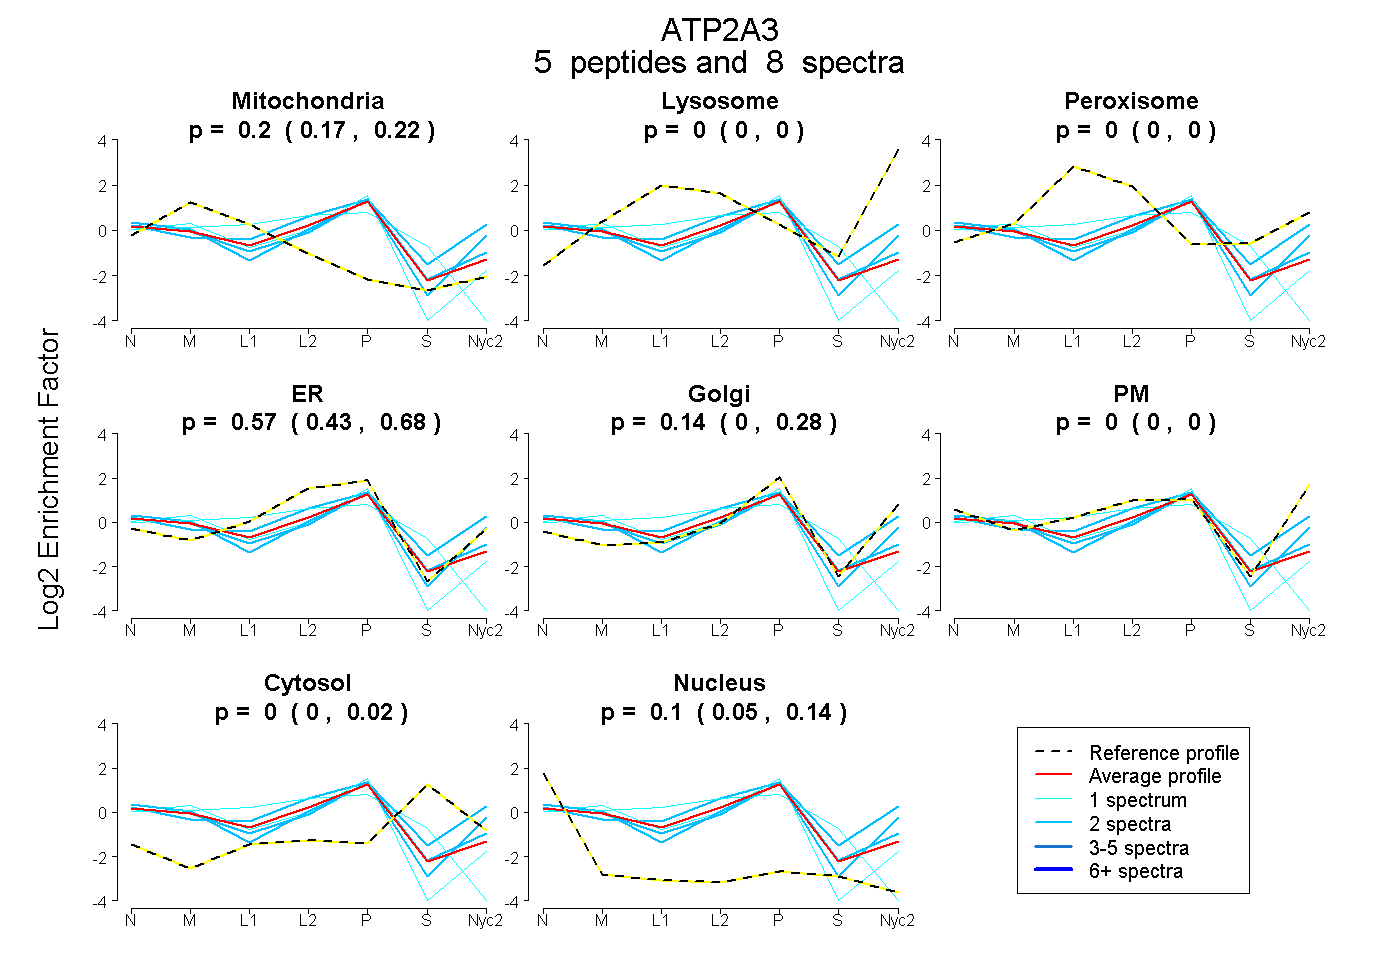
 5
5peptides
spectra
0.173 | 0.218
0.000 | 0.000
0.000 | 0.000
0.431 | 0.677
0.000 | 0.281
0.000 | 0.000
0.000 | 0.025
0.053 | 0.136
| Plot | Mito | Lyso | Perox | ER | Golgi | PM | Cytosol | Nucleus | |||||
| Expt A |
5 peptides |
8 spectra |
|
0.197 0.173 | 0.218 |
0.000 0.000 | 0.000 |
0.000 0.000 | 0.000 |
0.569 0.431 | 0.677 |
0.137 0.000 | 0.281 |
0.000 0.000 | 0.000 |
0.000 0.000 | 0.025 |
0.097 0.053 | 0.136 |
| 1 spectrum, YGPNELPTEEGK | 0.385 | 0.000 | 0.000 | 0.444 | 0.000 | 0.000 | 0.136 | 0.035 | ||
| 2 spectra, LGIFGDTEDVLGK | 0.042 | 0.000 | 0.002 | 0.320 | 0.155 | 0.348 | 0.132 | 0.000 | ||
| 2 spectra, TVPLSATSR | 0.157 | 0.000 | 0.000 | 0.171 | 0.569 | 0.032 | 0.000 | 0.071 | ||
| 1 spectrum, SMSVYCTPTR | 0.214 | 0.000 | 0.000 | 0.668 | 0.000 | 0.000 | 0.000 | 0.118 | ||
| 2 spectra, EFDDLSPEQQR | 0.188 | 0.000 | 0.000 | 0.330 | 0.391 | 0.000 | 0.000 | 0.092 |
| Plot | Lyso | Other | |||||||||||
| Expt C |
4 peptides |
6 spectra |
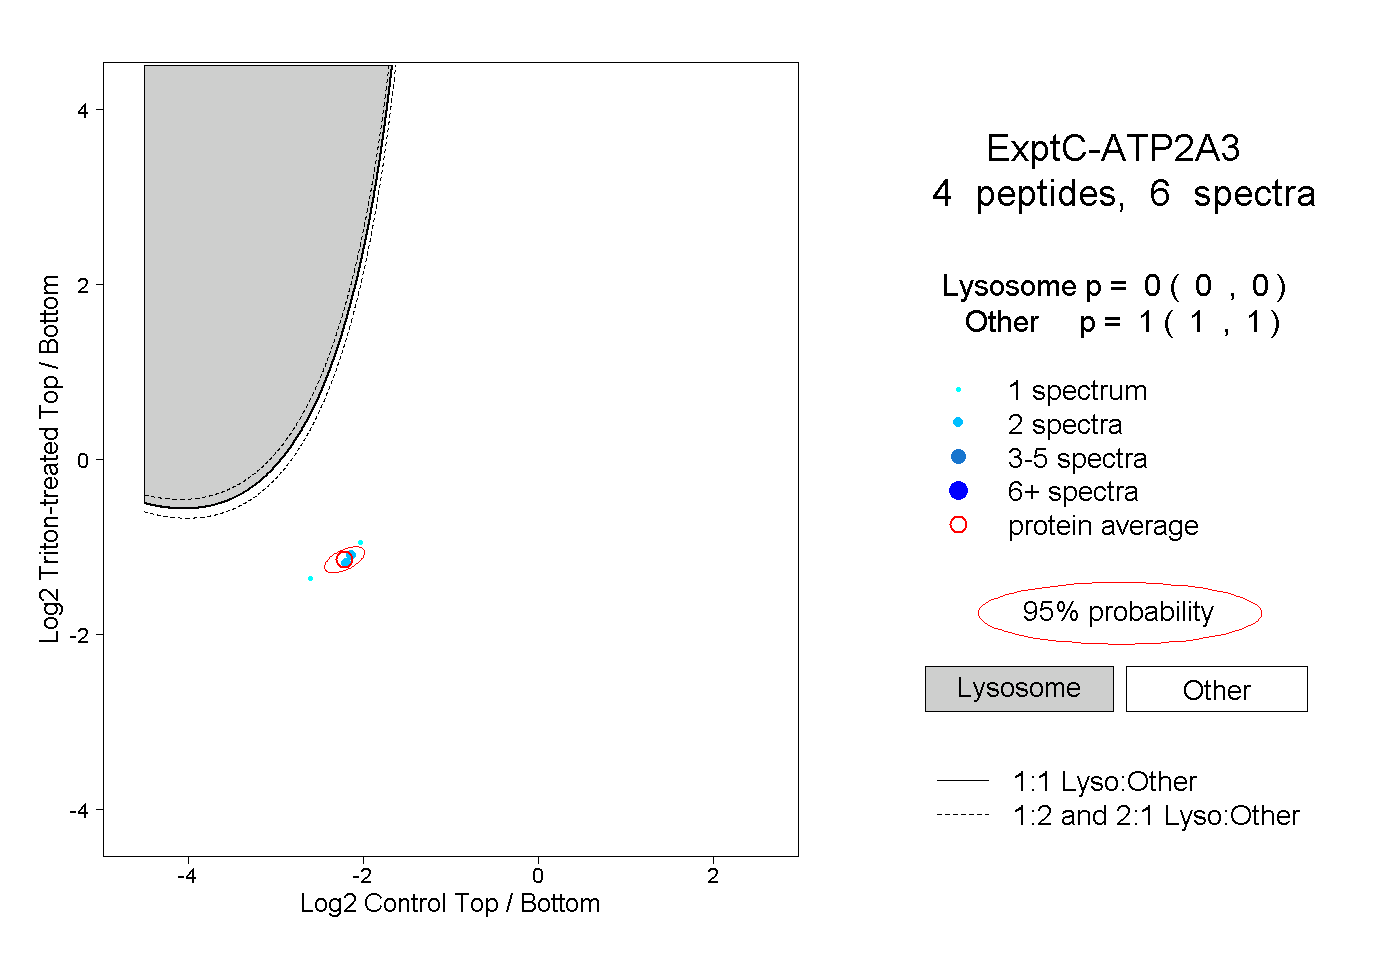 |
0.000 0.000 | 0.000 |
1.000 1.000 | 1.000 |
||||||||
| Plot | Lyso | Other | |||||||||||
| Expt D |
2 peptides |
2 spectra |
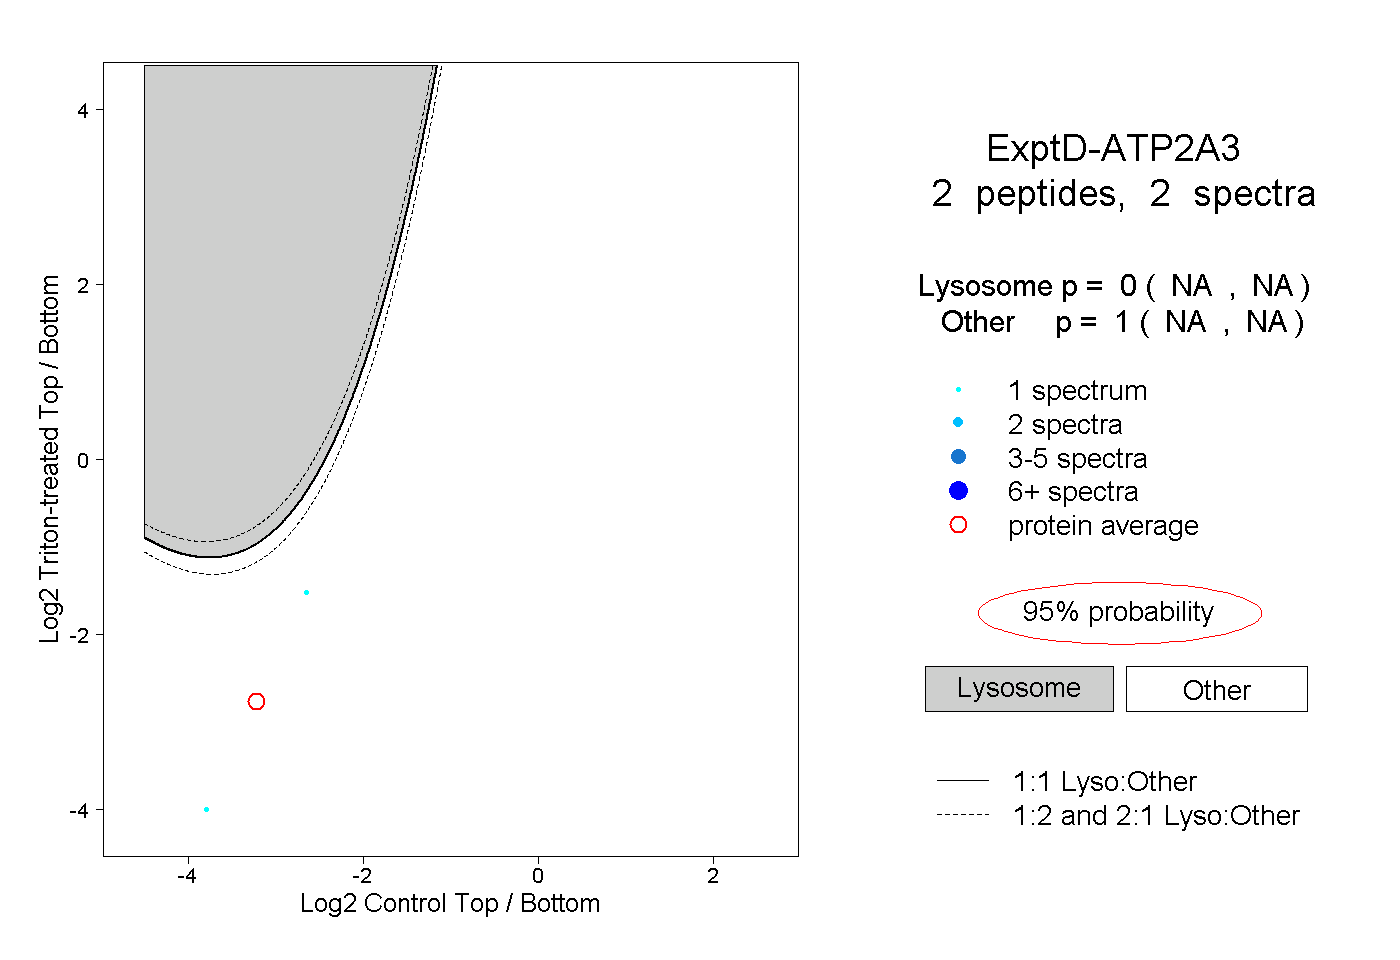 |
0.000 NA | NA |
1.000 NA | NA |