 2
2peptides
spectra
0.000 | 0.000
0.000 | 0.230
0.000 | 0.000
0.000 | 0.000
0.000 | 0.240
0.000 | 0.396
0.502 | 0.698
0.000 | 0.000
1peptide
spectra

0.000 | 0.000
1.000 | 1.000
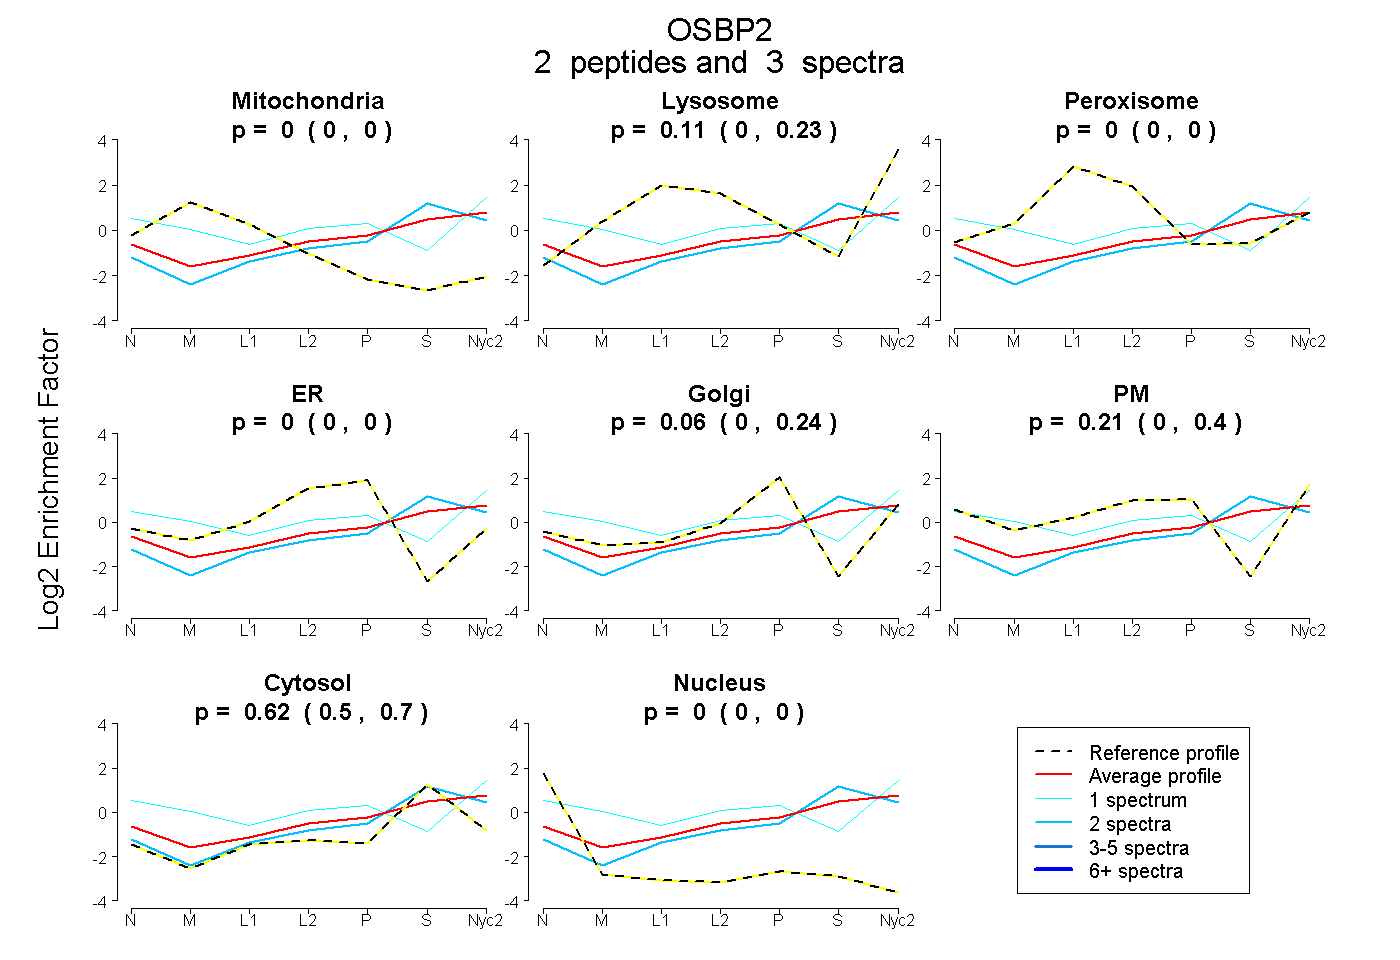
| Plot | Mito | Lyso | Perox | ER | Golgi | PM | Cytosol | Nucleus | |||||
| Expt A |
2 peptides |
3 spectra |
|
0.000 0.000 | 0.000 |
0.106 0.000 | 0.230 |
0.000 0.000 | 0.000 |
0.000 0.000 | 0.000 |
0.060 0.000 | 0.240 |
0.211 0.000 | 0.396 |
0.623 0.502 | 0.698 |
0.000 0.000 | 0.000 |
||
| Plot | Lyso | Other | |||||||||||
| Expt C |
1 peptide |
3 spectra |
|
0.000 0.000 | 0.000 |
1.000 1.000 | 1.000 |