 3
3peptides
spectra
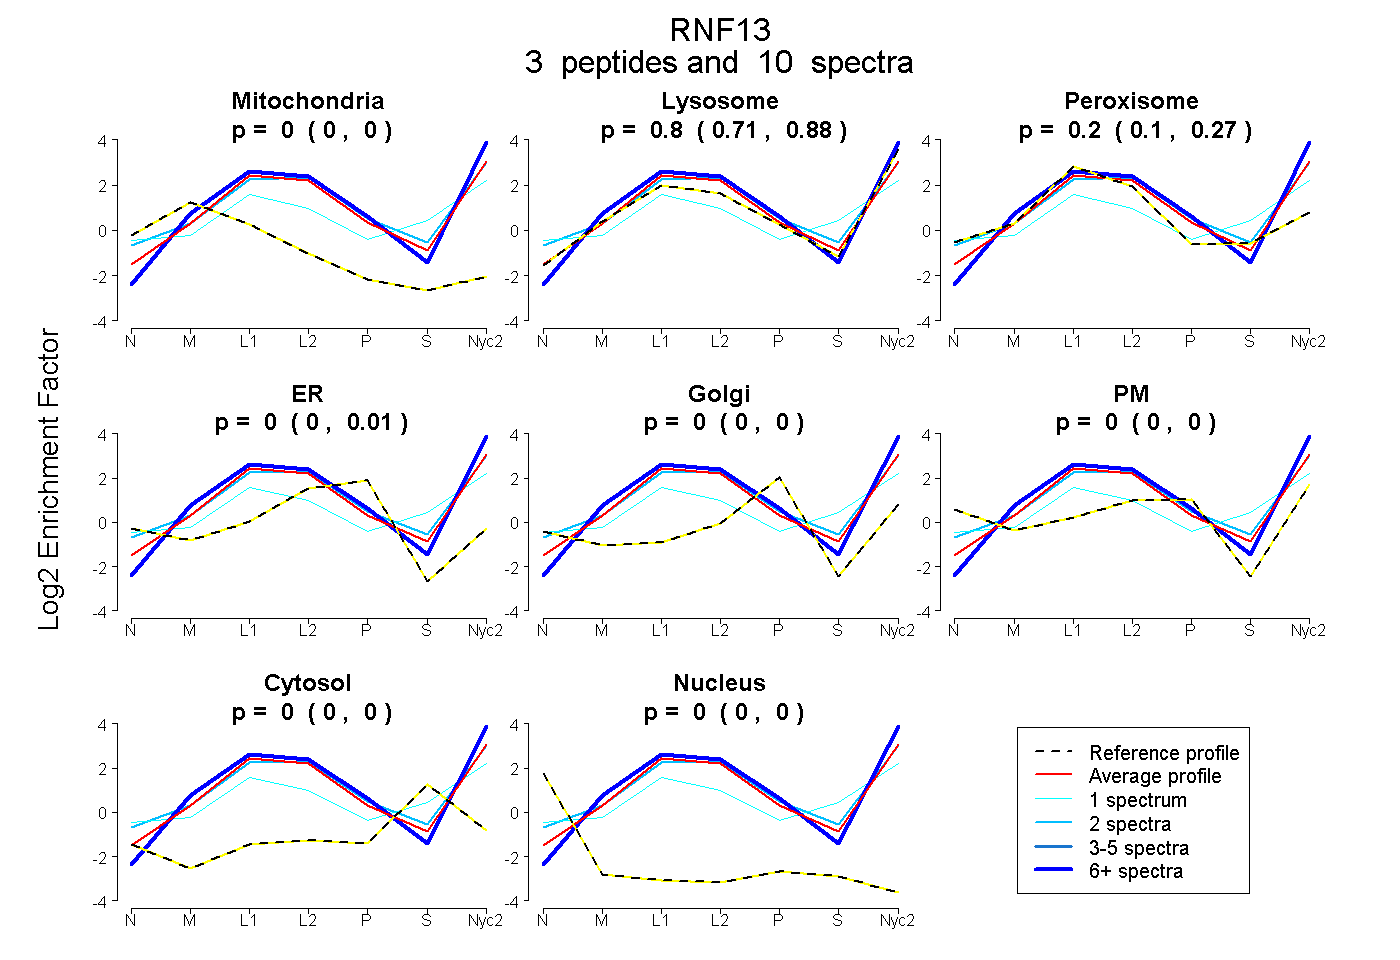
0.000 | 0.000
0.710 | 0.879
0.101 | 0.268
0.000 | 0.006
0.000 | 0.000
0.000 | 0.000
0.000 | 0.000
0.000 | 0.000
6peptides
spectra
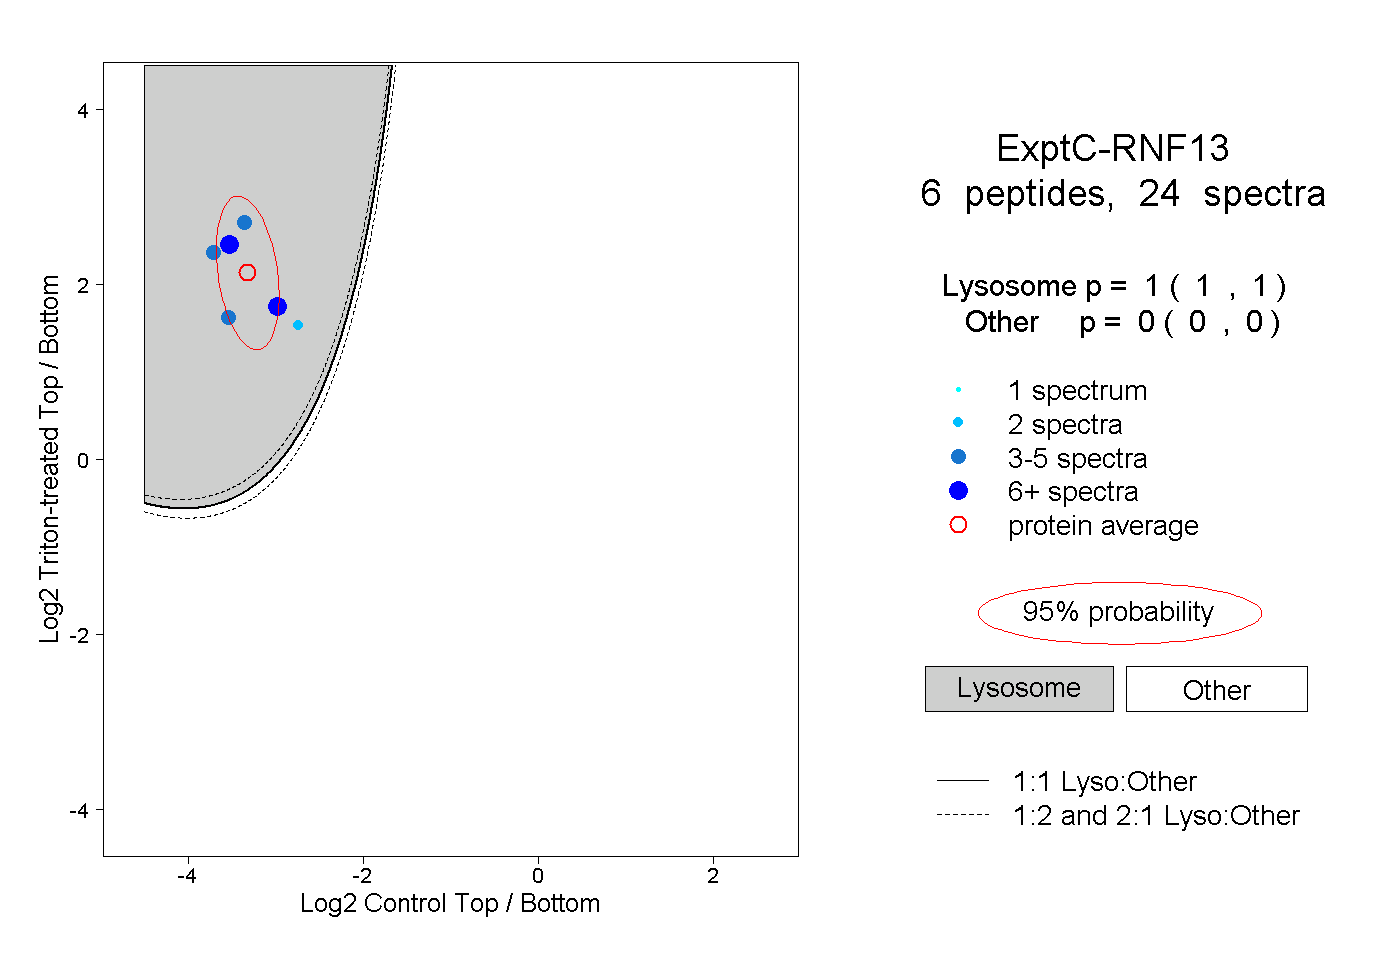
1.000 | 1.000
0.000 | 0.000
4peptides
spectra
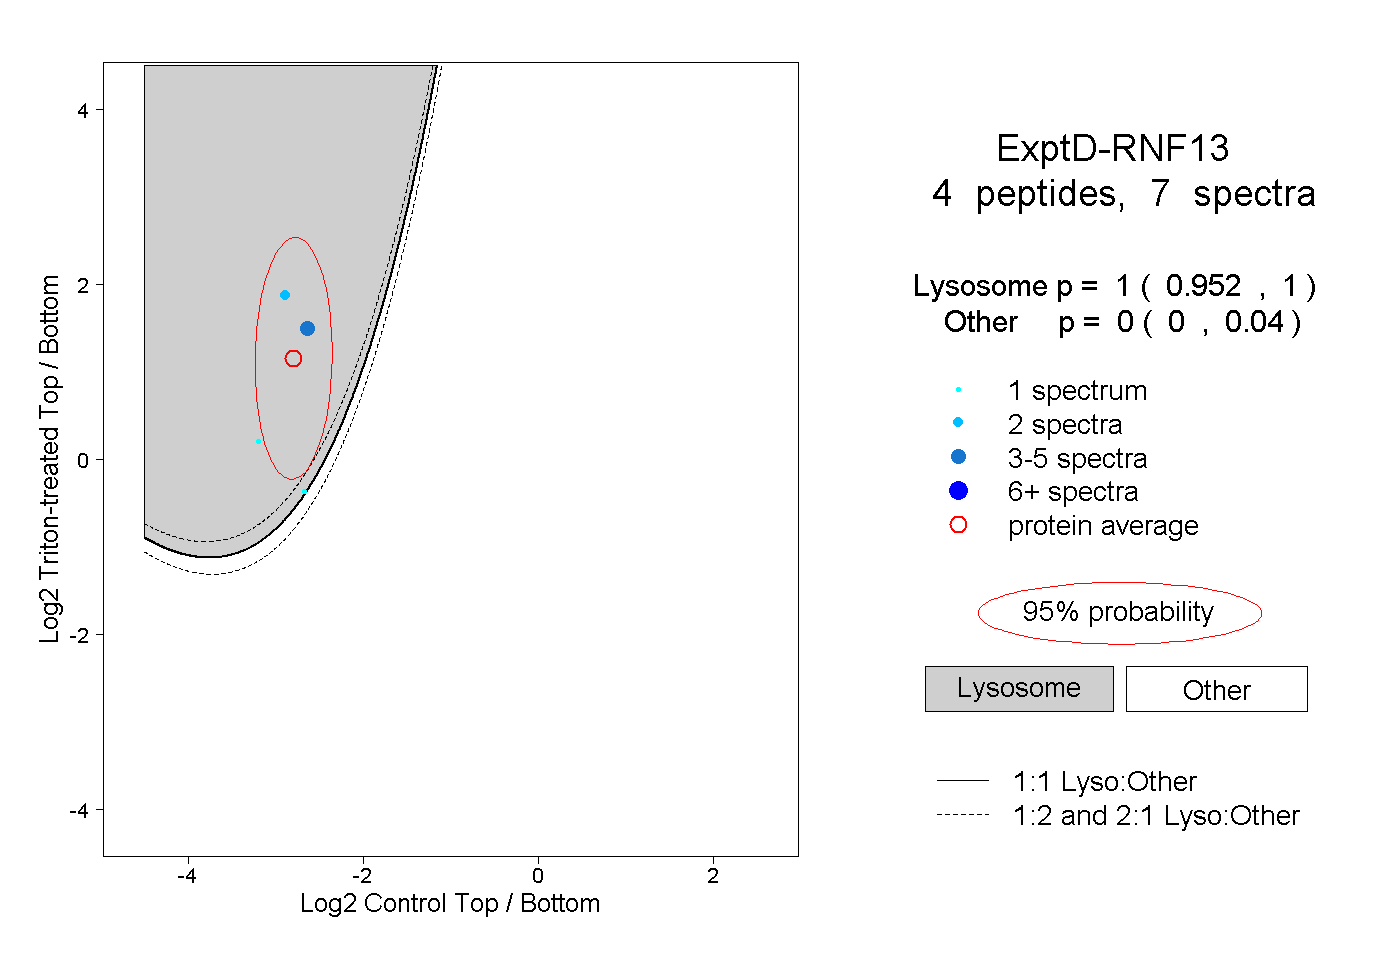
0.952 | 1.000
0.000 | 0.040