 2
2peptides
spectra
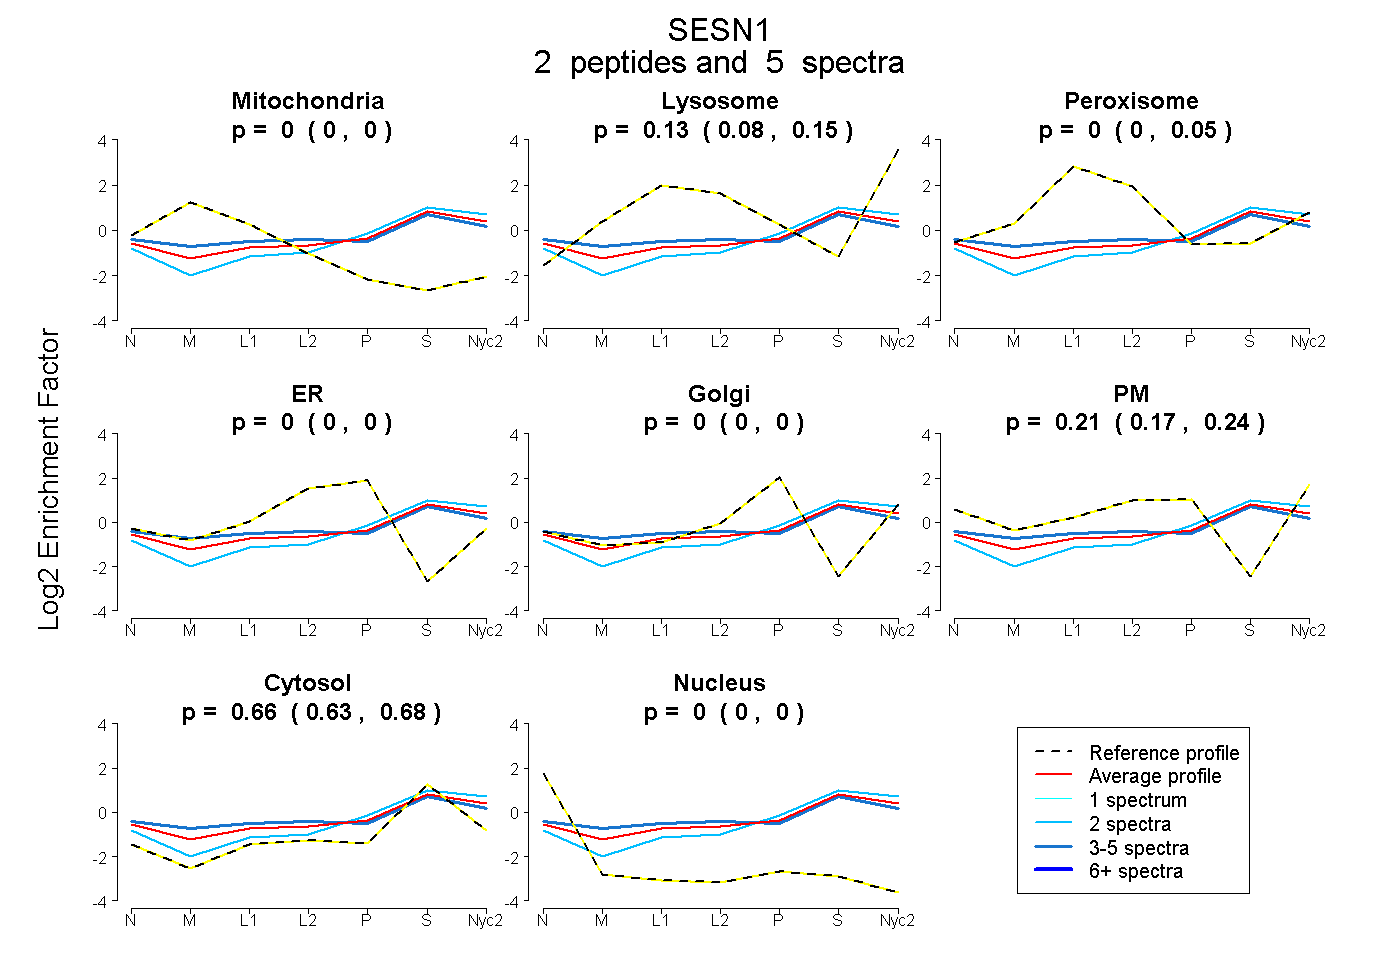
0.000 | 0.000
0.076 | 0.151
0.000 | 0.050
0.000 | 0.000
0.000 | 0.000
0.174 | 0.237
0.634 | 0.683
0.000 | 0.000
| Plot | Mito | Lyso | Perox | ER | Golgi | PM | Cytosol | Nucleus | |||||
| Expt A |
2 peptides |
5 spectra |
|
0.000 0.000 | 0.000 |
0.127 0.076 | 0.151 |
0.000 0.000 | 0.050 |
0.000 0.000 | 0.000 |
0.000 0.000 | 0.000 |
0.210 0.174 | 0.237 |
0.663 0.634 | 0.683 |
0.000 0.000 | 0.000 |
| 3 spectra, VHVNLLLLEAR | 0.021 | 0.036 | 0.160 | 0.000 | 0.000 | 0.202 | 0.581 | 0.000 | ||
| 2 spectra, LYPDVGQLIDEK | 0.000 | 0.135 | 0.000 | 0.000 | 0.167 | 0.000 | 0.698 | 0.000 |