 2
2peptides
spectra
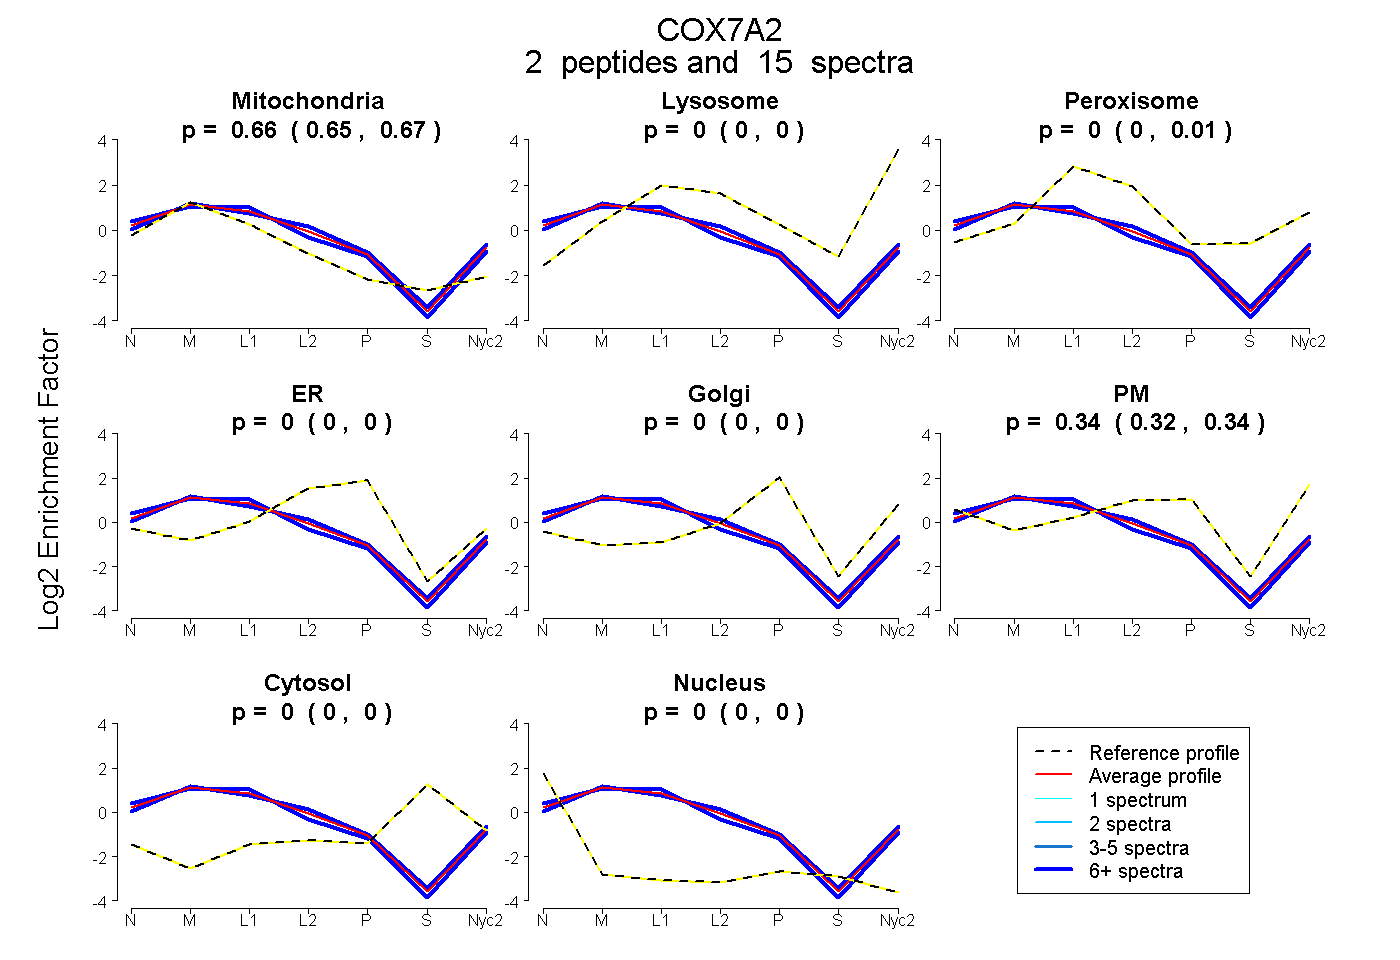
0.654 | 0.668
0.000 | 0.000
0.000 | 0.013
0.000 | 0.003
0.000 | 0.000
0.323 | 0.341
0.000 | 0.000
0.000 | 0.000
2peptides
spectra
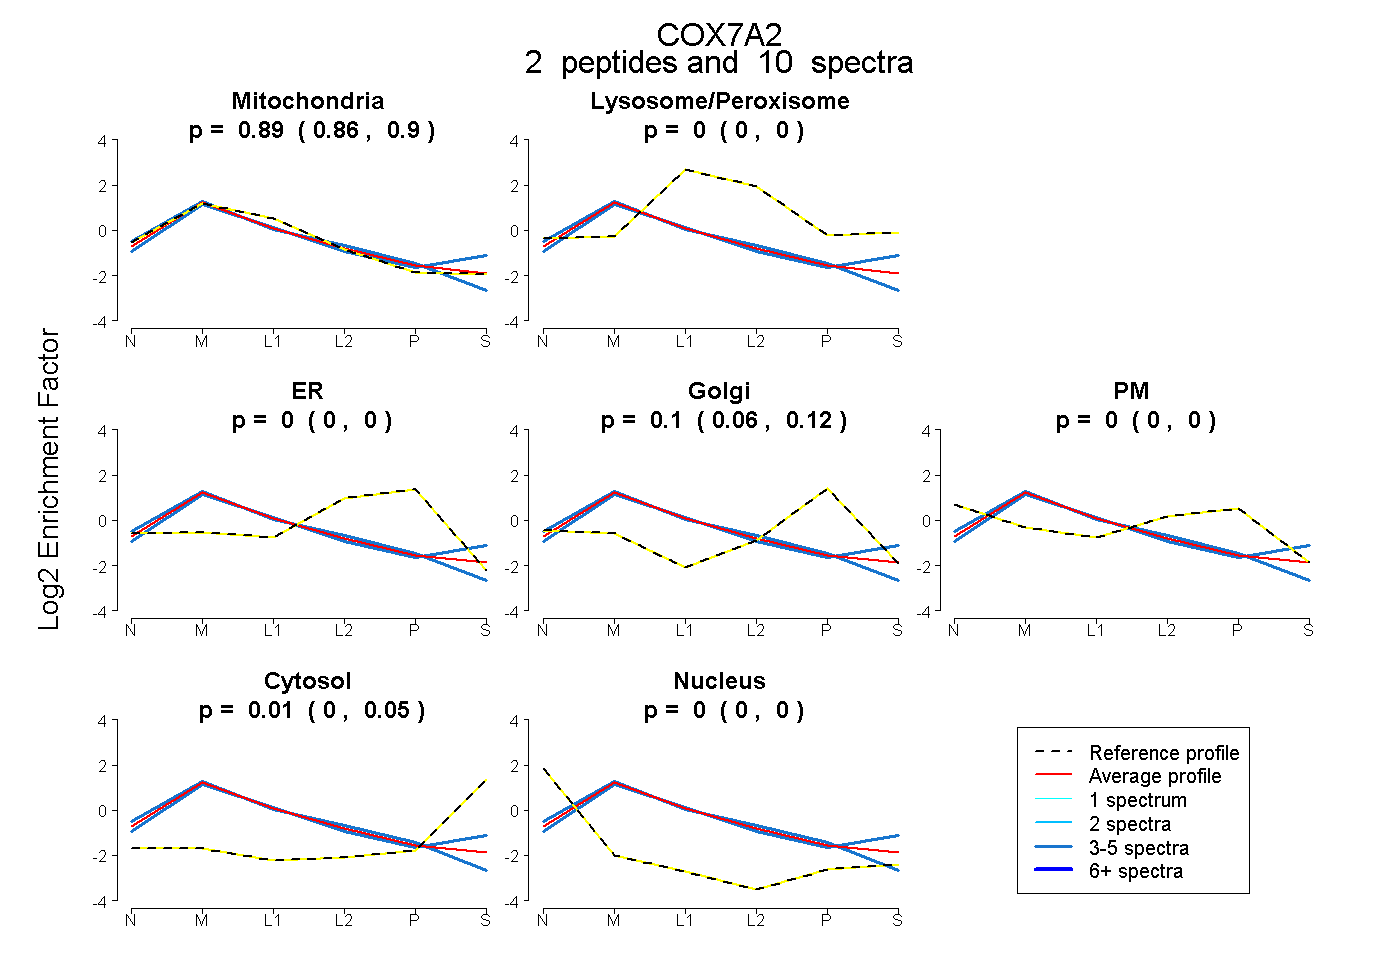
0.864 | 0.903
0.000 | 0.000
0.000 | 0.001
0.062 | 0.119
0.000 | 0.000
0.000 | 0.050
0.000 | 0.000
2peptides
spectra
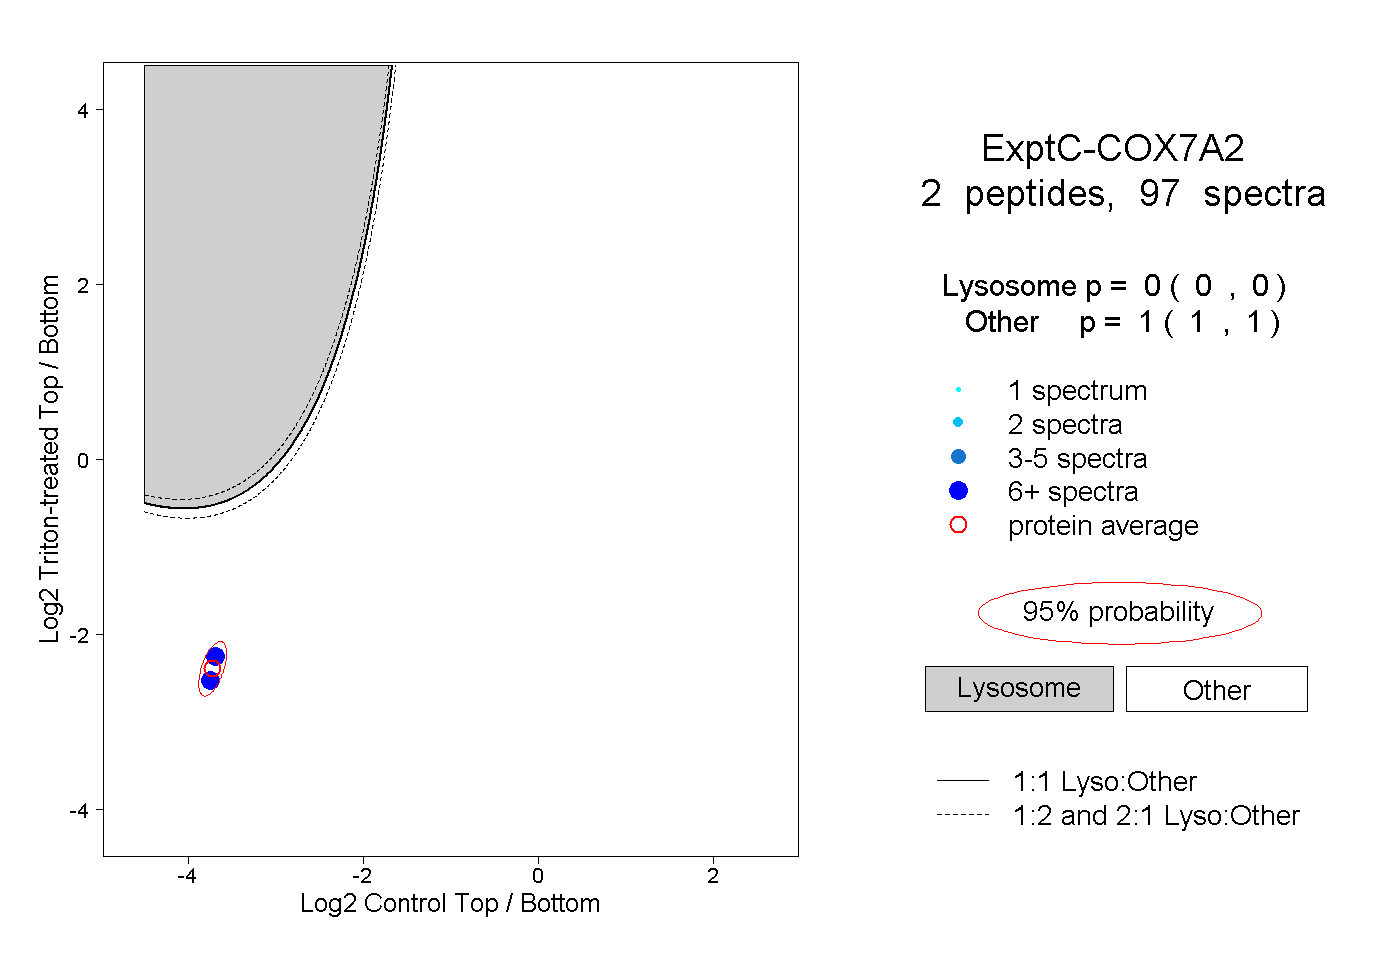
0.000 | 0.000
1.000 | 1.000
1peptide
spectra
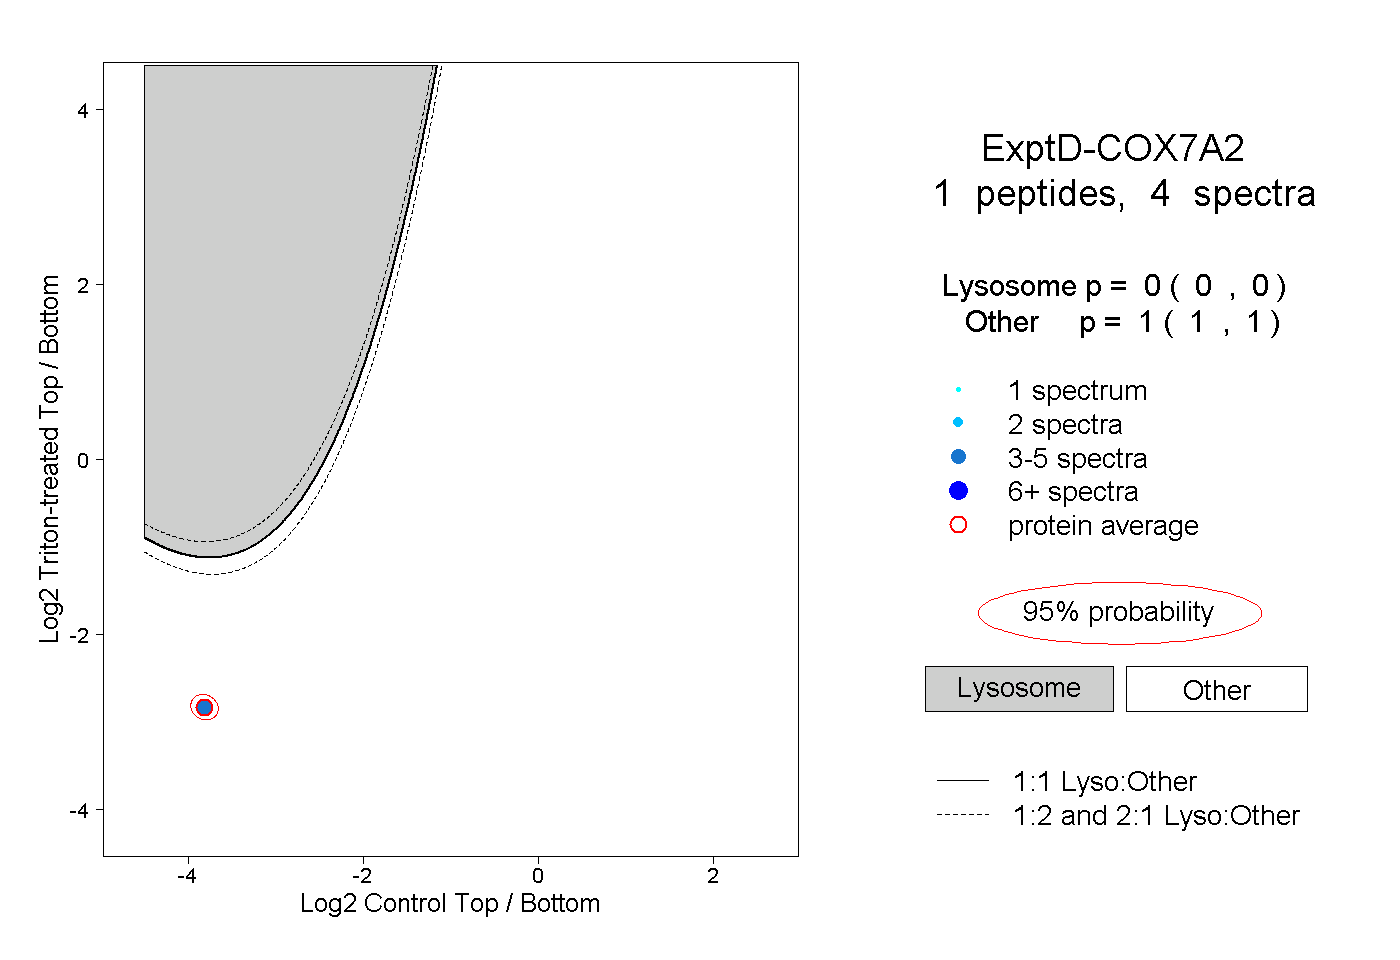
0.000 | 0.000
1.000 | 1.000