 11
11peptides
spectra
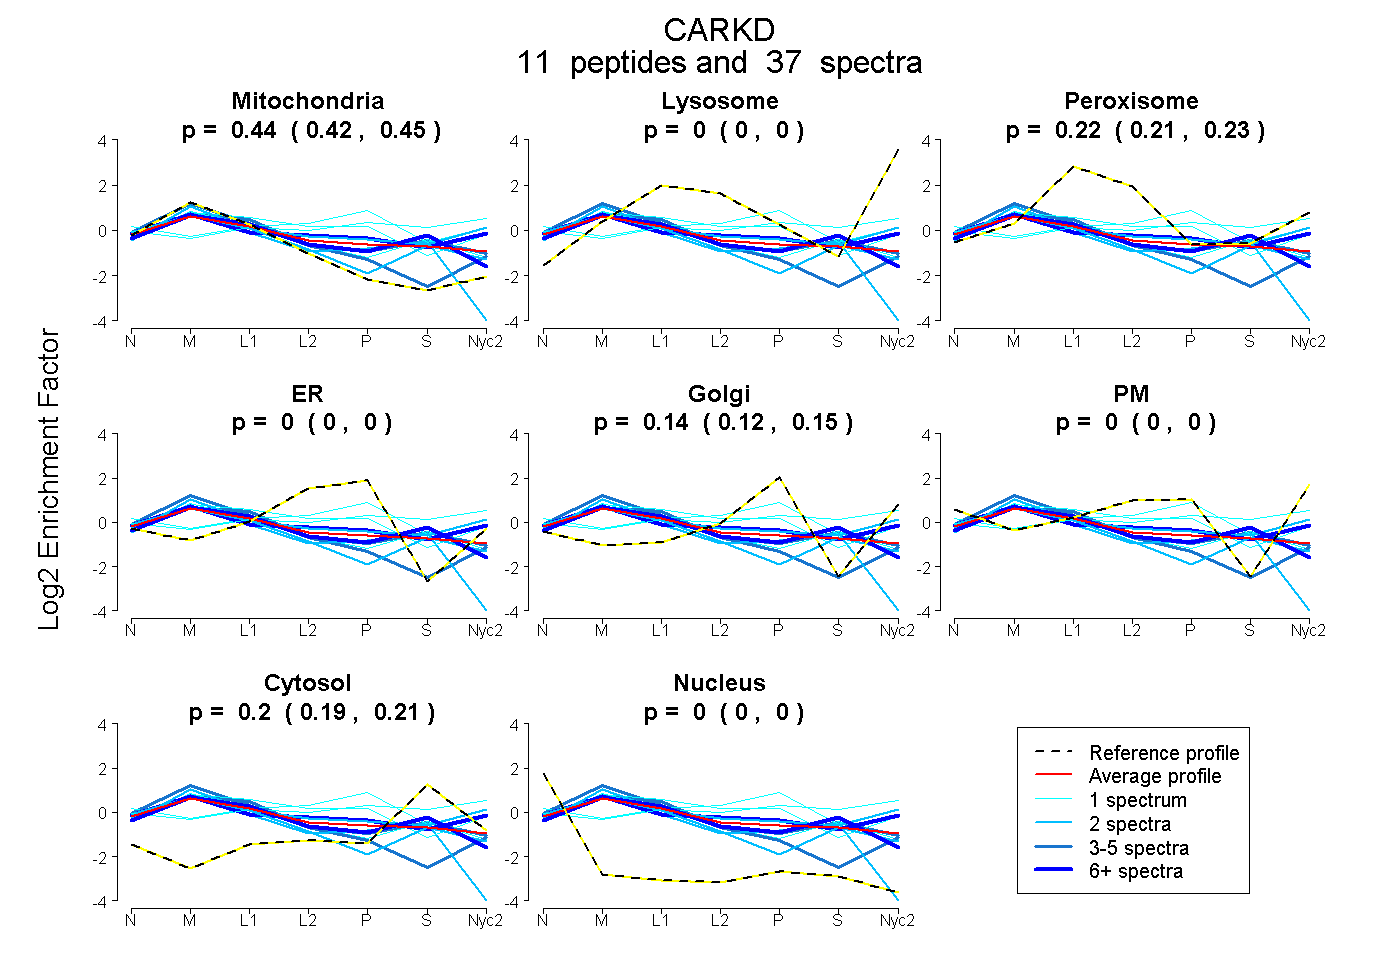
0.420 | 0.451
0.000 | 0.000
0.210 | 0.229
0.000 | 0.000
0.123 | 0.153
0.000 | 0.000
0.192 | 0.214
0.000 | 0.000
8peptides
spectra
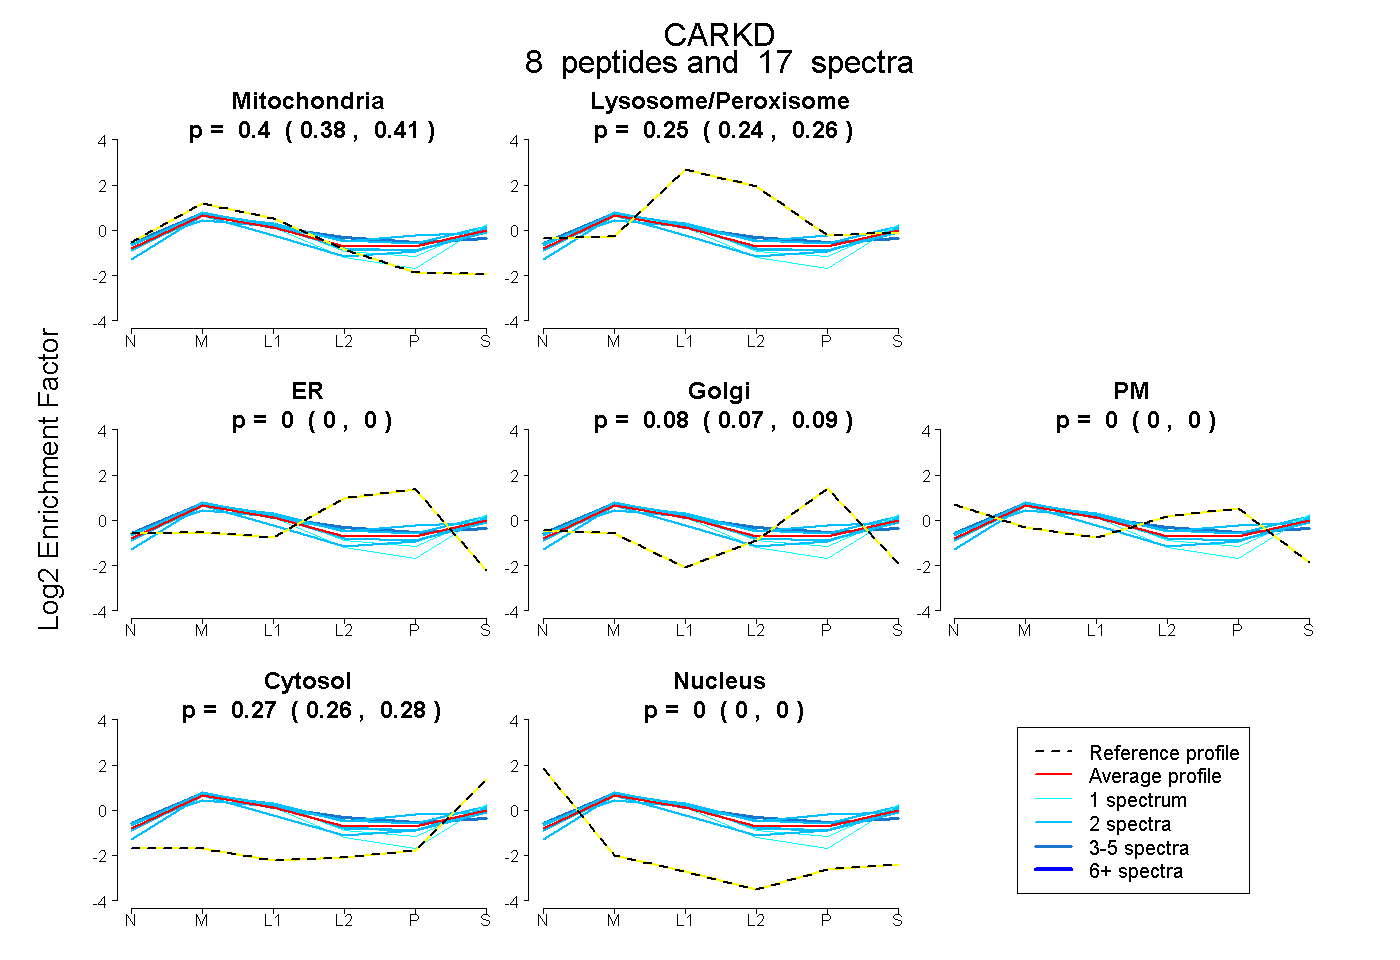
0.383 | 0.407
0.243 | 0.261
0.000 | 0.000
0.068 | 0.091
0.000 | 0.000
0.261 | 0.277
0.000 | 0.000
12peptides
spectra
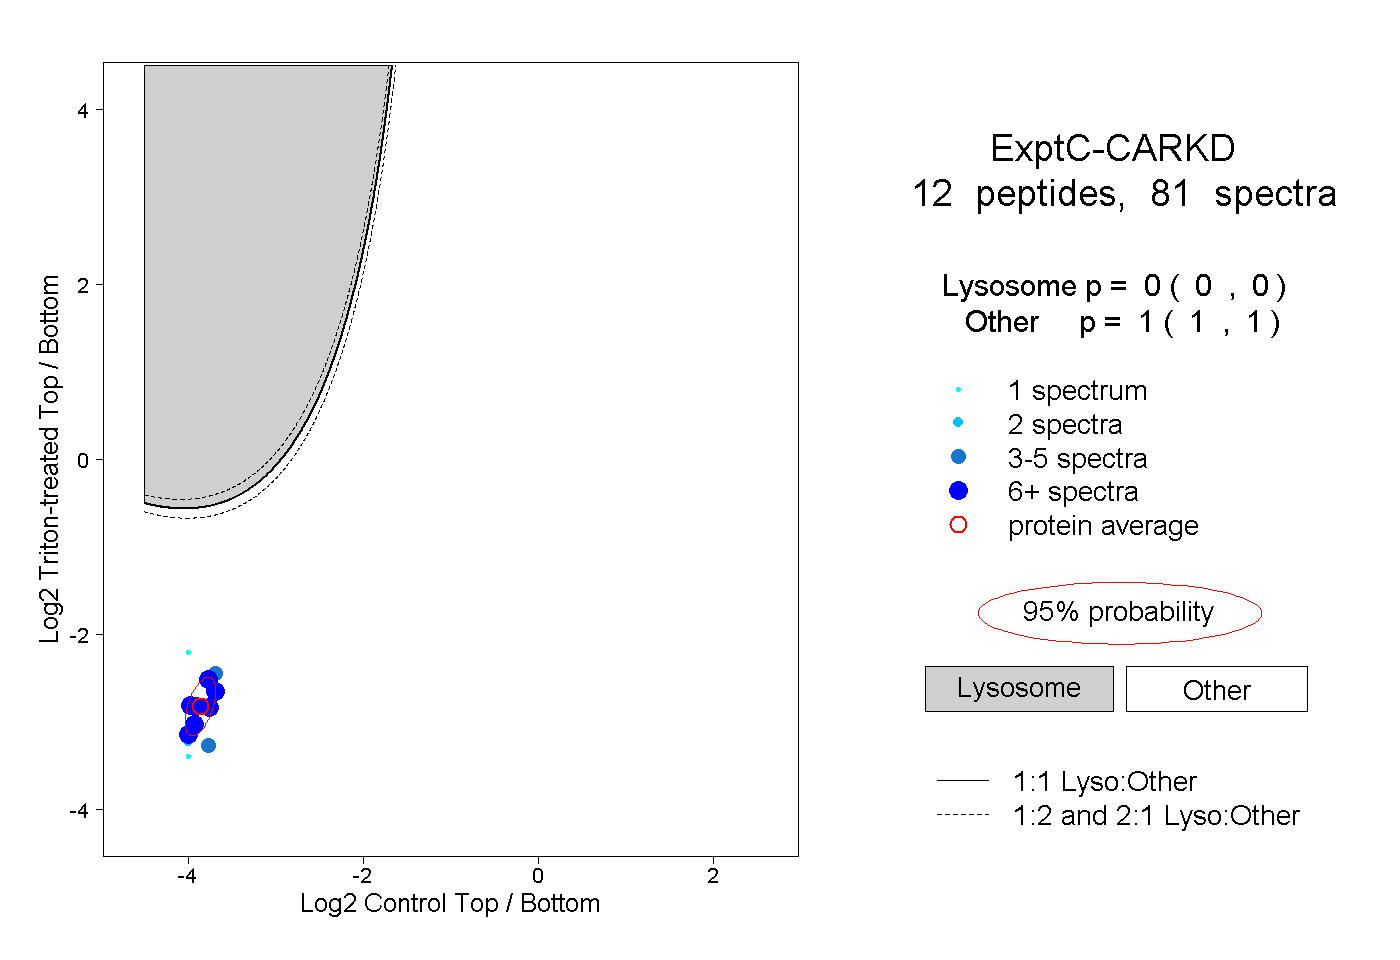
0.000 | 0.000
1.000 | 1.000
4peptides
spectra
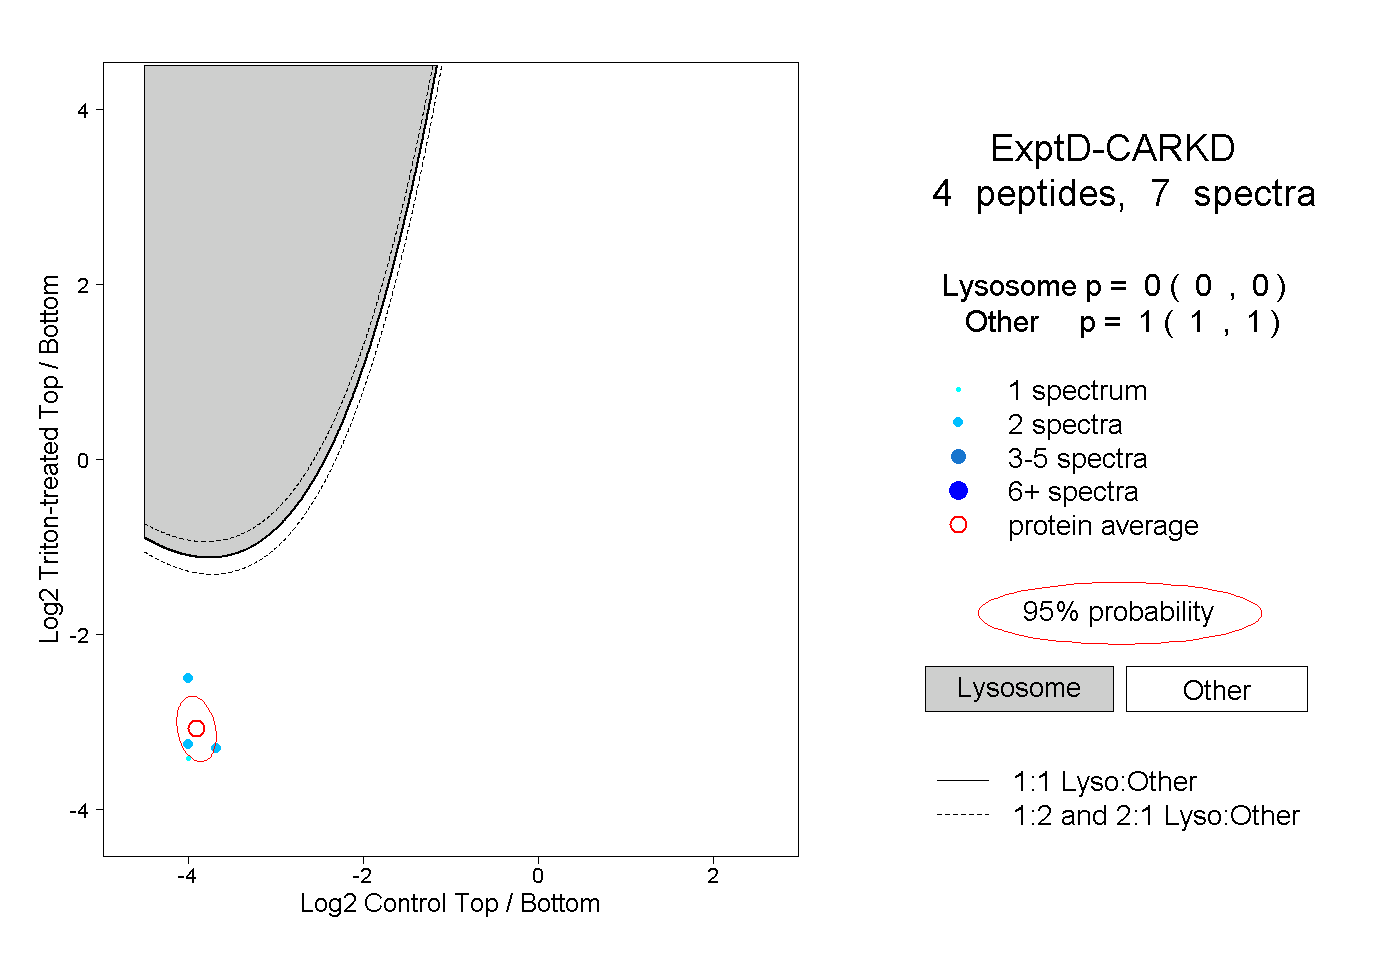
0.000 | 0.000
1.000 | 1.000