 2
2peptides
spectra
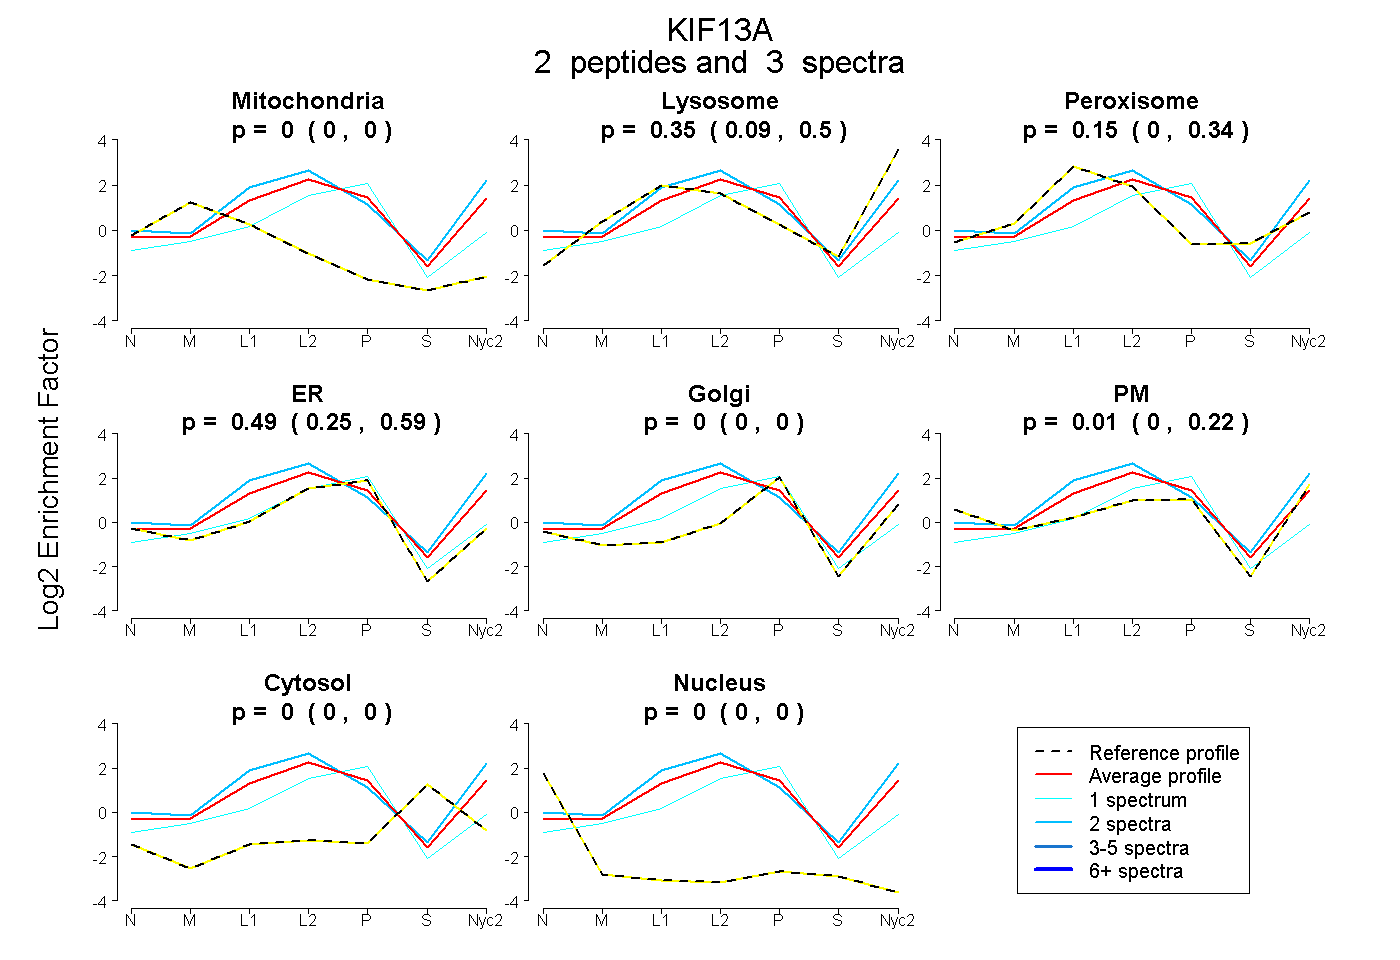
0.000 | 0.000
0.090 | 0.501
0.000 | 0.341
0.249 | 0.588
0.000 | 0.000
0.000 | 0.225
0.000 | 0.000
0.000 | 0.000
2peptides
spectra
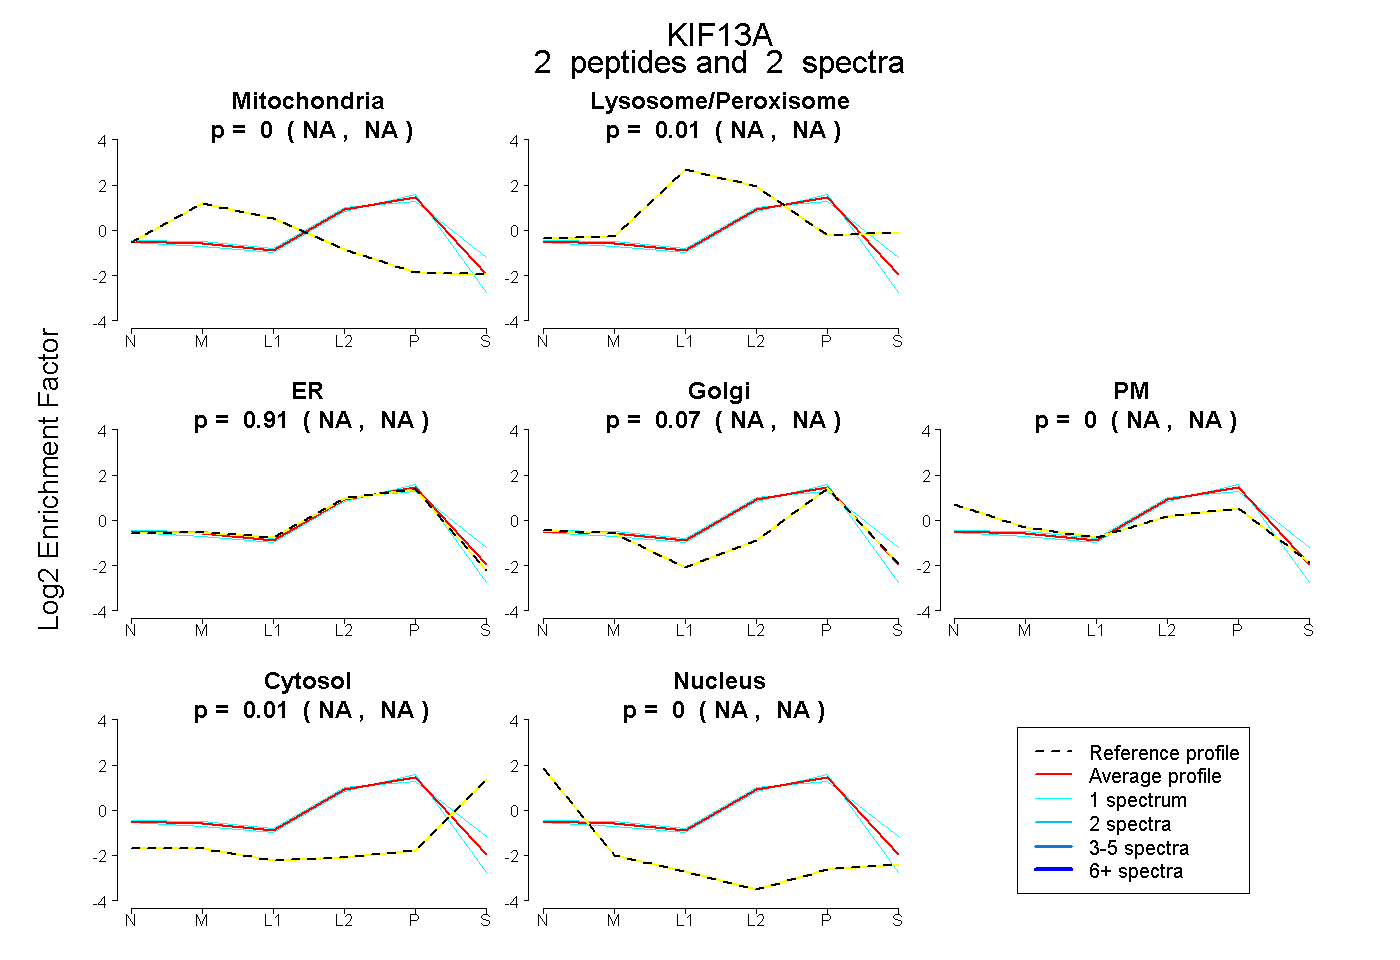
NA | NA
NA | NA
NA | NA
NA | NA
NA | NA
NA | NA
NA | NA
2peptides
spectra
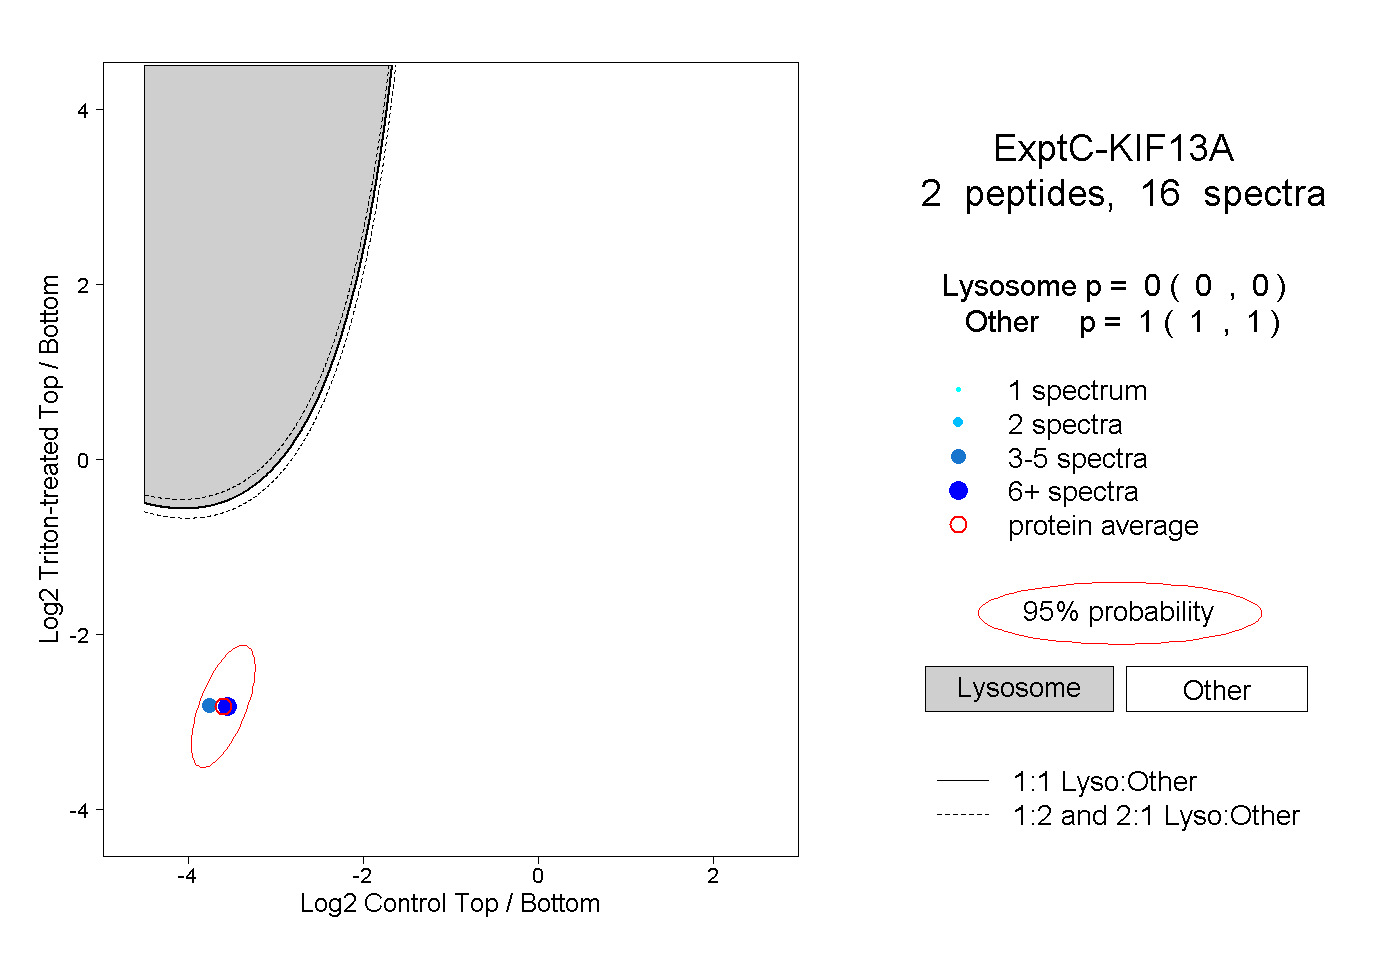
0.000 | 0.000
1.000 | 1.000
1peptide
spectra
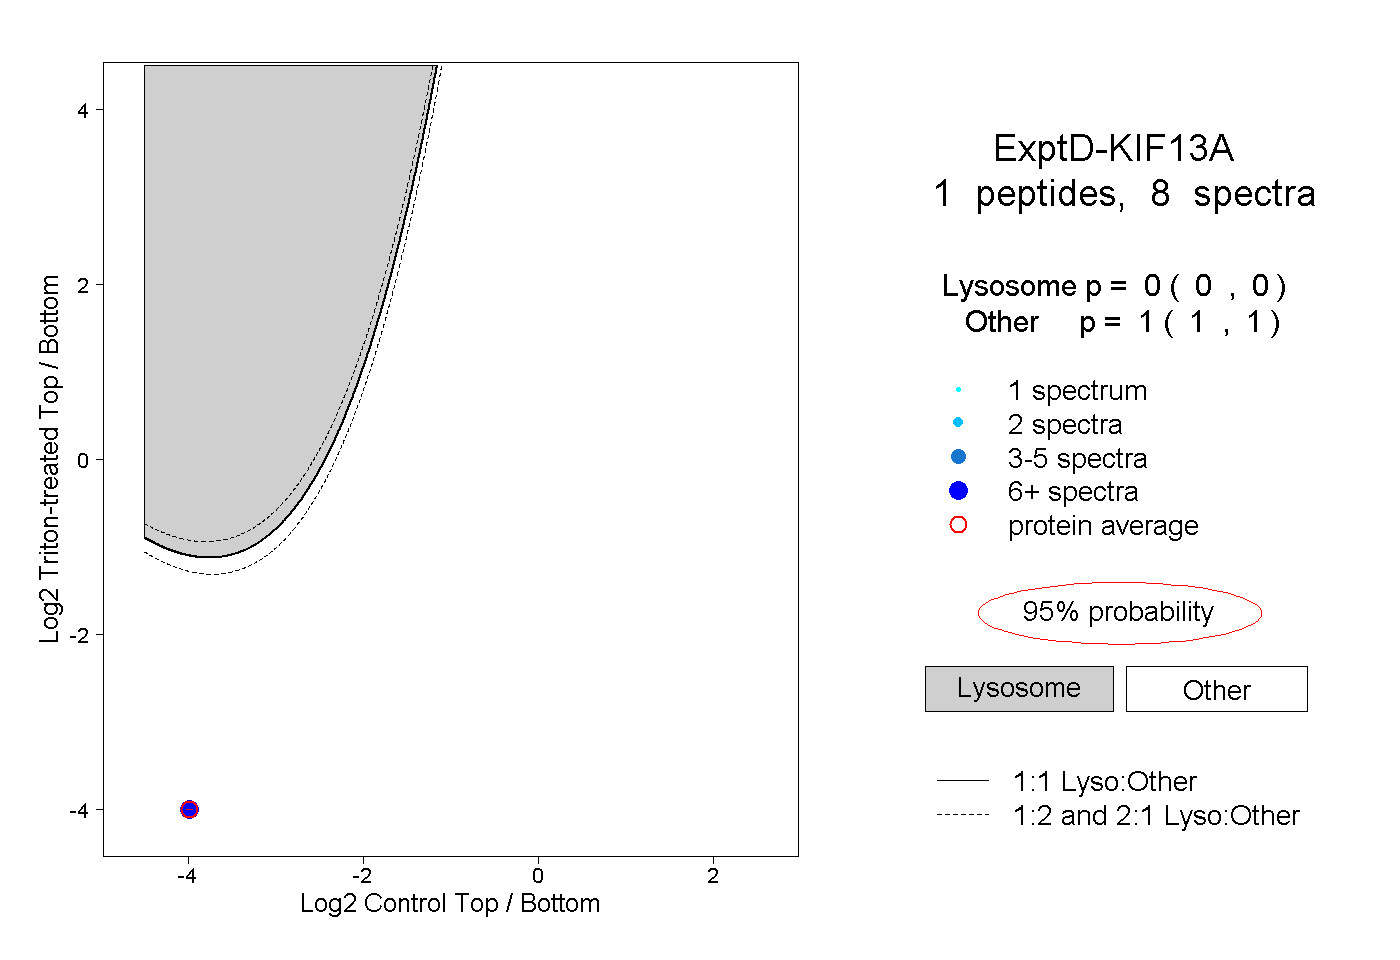
0.000 | 0.000
1.000 | 1.000